A RELION cryo-EM 3D classification, on spot, in your own AWS
The canonical RELION cryo-EM 3D classification (105,247 ribosome particles, EMPIAR-10028) on a single commodity A10G GPU in 3h 18m of AWS spot — 1h 36m on 4× A10G — with no HPC engineer and no data egress. Wall-clock matches published V100 and RTX 3090 numbers. Single-node, scoped honestly below.
The canonical RELION benchmark — 105,247 Plasmodium 80S ribosome particles, 3D classification into 6 classes, 25 iterations — run on a single commodity A10G GPU in 3 h 18 m of the customer's own AWS spot (a few dollars; ~$1.65 once right-sized), with no HPC engineer, no data egress, and the run parameters, cost, and outputs accreting as a queryable record in their account. The same job on 4× A10G finishes in 1 h 36 m, run as single-node MPI inside our containerized Slurm.
Companion to the OpenFE RBFE post — same operating model (managed Slurm, customer's AWS, spot economics), a different top-priority workload.
TL;DR (June 2 2026)
- Dataset: EMPIAR-10028, the Plasmodium falciparum 80S ribosome — the dataset the RELION team and every GPU vendor benchmark on. 105,247 pre-extracted particles, box 360 px, 1.34 Å/px. We run the canonical benchmark job verbatim:
relion_refine3D classification, K=6, 25 iterations. - Image: the community
jidaniel/relion:5.0-cuda12.6container (RELION 5.0, CUDA 12.6) via Apptainer —apptainer pullon the node, no build host needed. (Single-maintainer Docker Hub image; pinning to a digest / building our own RELION-5 SIF is queued hardening — see Honest scope.) - 1× A10G: 198 m 51 s (
g5spot), exit 0, dominant class torlnCurrentResolution9.65 Å (the per-iteration alignment limit, not a gold-standard FSC resolution — see Correctness), peak GPU memory 21.5 GB / 23 GB. - 4× A10G: 95 m 38 s —
mpirun -n 5, 4 ranks mapped 1:1 to 4 A10Gs inside one pod. 2.07× speedup (sub-linear, in the same band as the published curves). - Cost: the headline run cost ~$4 on the
g5.4xlargespot node it actually landed on; ~$1.65 once right-sized to ag5.xlarge(the template default going forward). ~$4 on the 4-GPU box. The single GPU is cheaper per result; the 4-GPU box is faster wall-clock. Pick by urgency. - vs CPU: roughly ~12× slower per iteration on a ~20-core CPU node — reported as a floor, because the CPU run timed out at our 3 h cap having completed only 3 of 25 iterations (one CPU iteration ≈ 1.6–2 h vs the GPU's ~8 min). (in-house, same environment — see Results.)
- Spot: the two headline runs completed without interruption. A third replicate was genuinely reclaimed and requeued on scarce
g5spot — and because the template only does a plain requeue, it restarted from iteration 0. That's the lived evidence the checkpoint-resume gap (--continue) is real, not hypothetical (see The operating model). - n: headline 1× A10G is n=2 (198 m 51 s / 198 m 56 s — ~0.5% spread); we attempted n=3 but the third replicate kept getting reclaimed on spot and was abandoned. Scaling and CPU runs n=1.
Setup
Target. The Plasmodium falciparum 80S ribosome (Wong et al., eLife 2014). Deliberately the canonical, well-behaved benchmark — the right fixture for proving the managed pipeline produces correct, literature-grade results, not a claim about solving hard novel structures. The whole point of EMPIAR-10028 is that there are published wall-clock numbers for the identical job on other GPUs, so our A10G number slots into a recognized table.
Data. We download the MRC-LMB relion_benchmark package (47 GiB, pre-extracted particles + the emd_2660.map reference) — not the 1.2 TB raw EMPIAR deposit. So we run classification directly, no motion-correction / CTF / picking / extraction pipeline. 105,247 particles, box 360, 1.34 Å/px, staged once to the cluster's EFS.
Job (verbatim MRC-LMB benchmark).
relion_refine --i Particles/shiny_2sets.star --ref emd_2660.map:mrc \
  --firstiter_cc --ini_high 60 --ctf --ctf_corrected_ref \
  --iter 25 --tau2_fudge 4 --particle_diameter 360 --K 6 \
  --flatten_solvent --zero_mask --oversampling 1 --healpix_order 2 \
  --offset_range 5 --offset_step 2 --sym C1 --norm --scale \
  --random_seed 0 --pool 30 --j 6 --gpu --scratch_dir <local NVMe>
--scratch_dir on the instance's local NVMe is load-bearing — RELION copies the particle stack off EFS once, then does its many random reads against fast local disk.
Results
Wall-clock — same dataset, same job definition
| Run | Hardware | Wall-clock | n |
|---|---|---|---|
| 1× A10G (this run) | g5 spot |
198 m 51 s / 198 m 56 s (mean 198.9 m) | n=2 (3rd reclaimed, abandoned) |
| 4× A10G (this run) | g5.12xlarge spot |
95 m 38 s | 1 |
| CPU (this run) | ~20-core spot | ~12× slower/iter — DNF (timed out, iter 3/25) | 1 |
| — published — | |||
| 1× Tesla V100 | MRC-LMB (RELION 3) | 3 h 06 m | 1 |
| 4× Tesla V100 | MRC-LMB (RELION 3) | 1 h 12 m | 1 |
| 4× RTX 3090 | linuxvixion (RELION 3.1) | 43 m | 1 |
A single A10G (198 min) lands just above a single V100 (186 min) — i.e. slightly slower, right where it should: the A10G is a slightly slower card for this FP32-heavy workload, and there was no published A10G number for this job until now, so this fills a real gap. The CPU comparison is one-sided enough that an exact number isn't needed: the CPU run timed out at our 3 h cap having finished only 3 of 25 iterations, with a single iteration's expectation step taking ~1.6–2 h against the GPU's ~8-minute full iteration — roughly an order of magnitude (~12×), reported as a floor since the CPU job never converged.
Read the comparison honestly: these are the same dataset and same job definition (K=6, 25 iter, box 360), but the published numbers are RELION 2/3 and ours is RELION 5.0 — whose GPU code path differs. This is "same canonical benchmark, modern stack," not a controlled version-to-version delta. We make no claim that the A10G/V100 gap is a clean hardware ratio.
Scaling: 1 → 4 GPUs = 2.07×
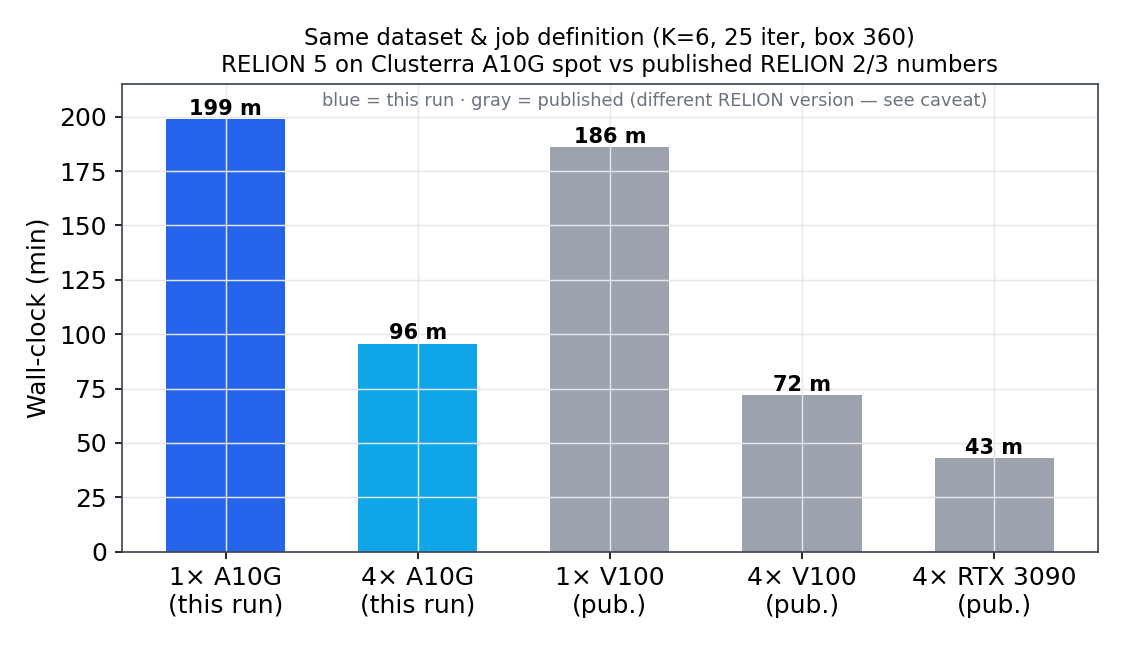
Four times the GPUs buys 2.07× the throughput — sub-linear, and consistent with the published curves (V100 1→4 was 2.6×, RTX 3090 2→4 was 1.65×). RELION's 3D classification alternates a GPU-bound expectation step with a partly CPU-bound maximization step and per-iteration disk I/O, so adding GPUs has diminishing returns. This is the honest shape of the workload, and it drives the cost story below.
Did it actually work? — a real result, not fast noise
The output of a 3D classification is not one structure — it's the partition of the particles into K classes. Here is what the job actually produced: 105,247 particles sorted into 6 classes.
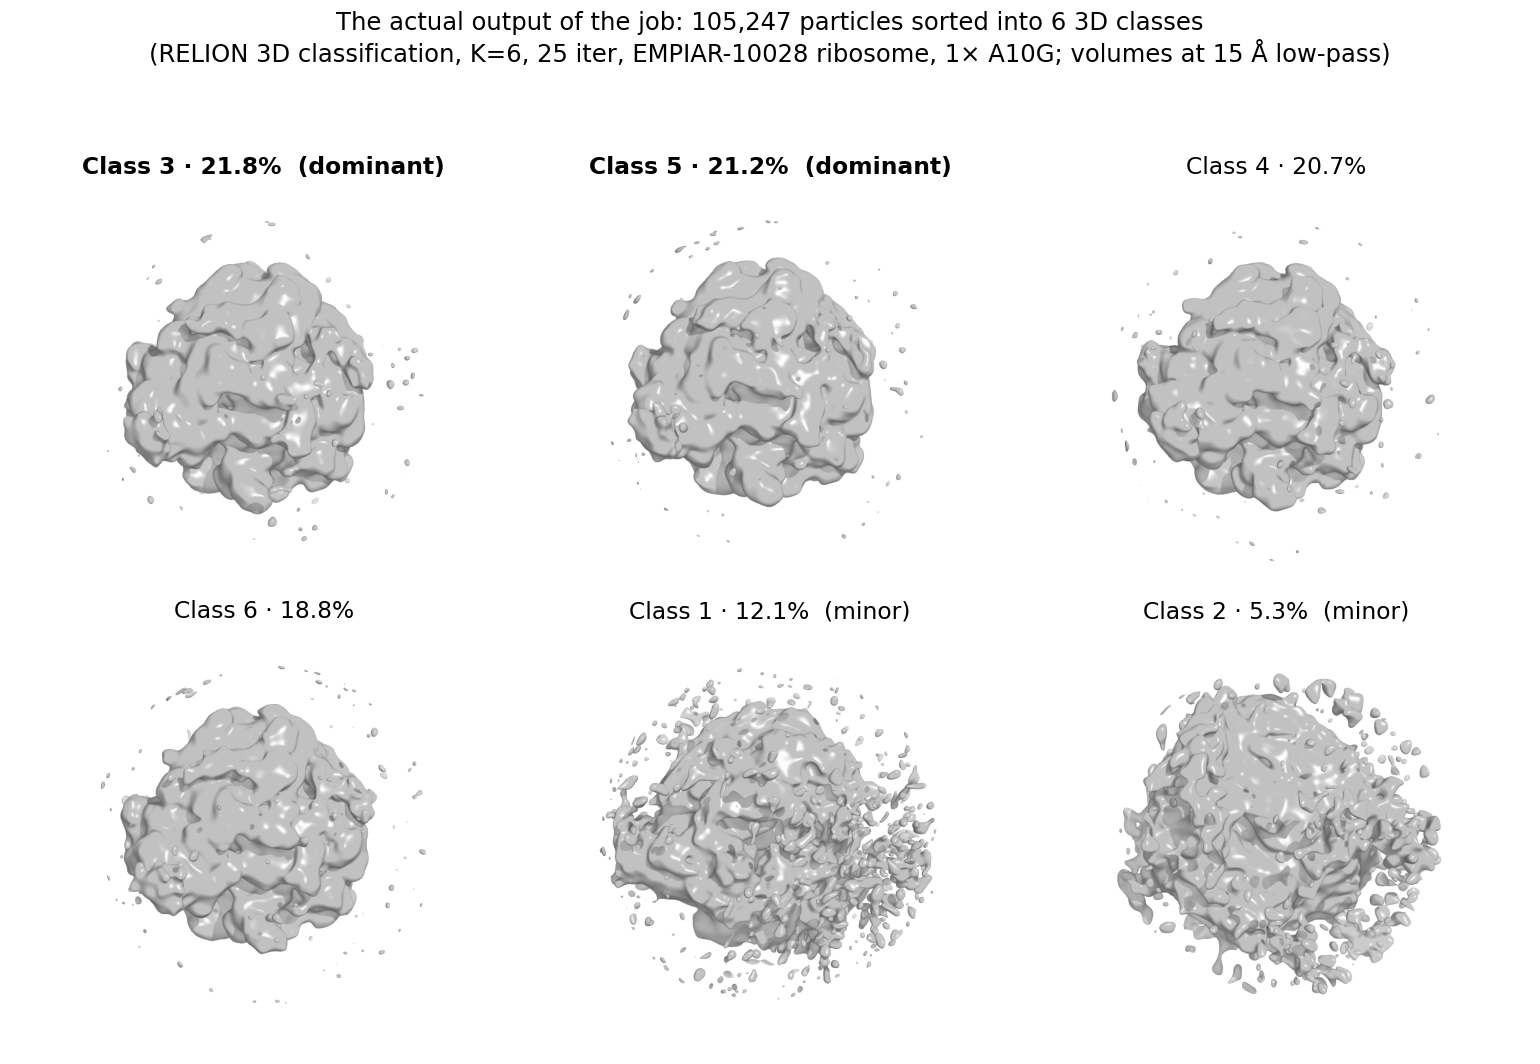
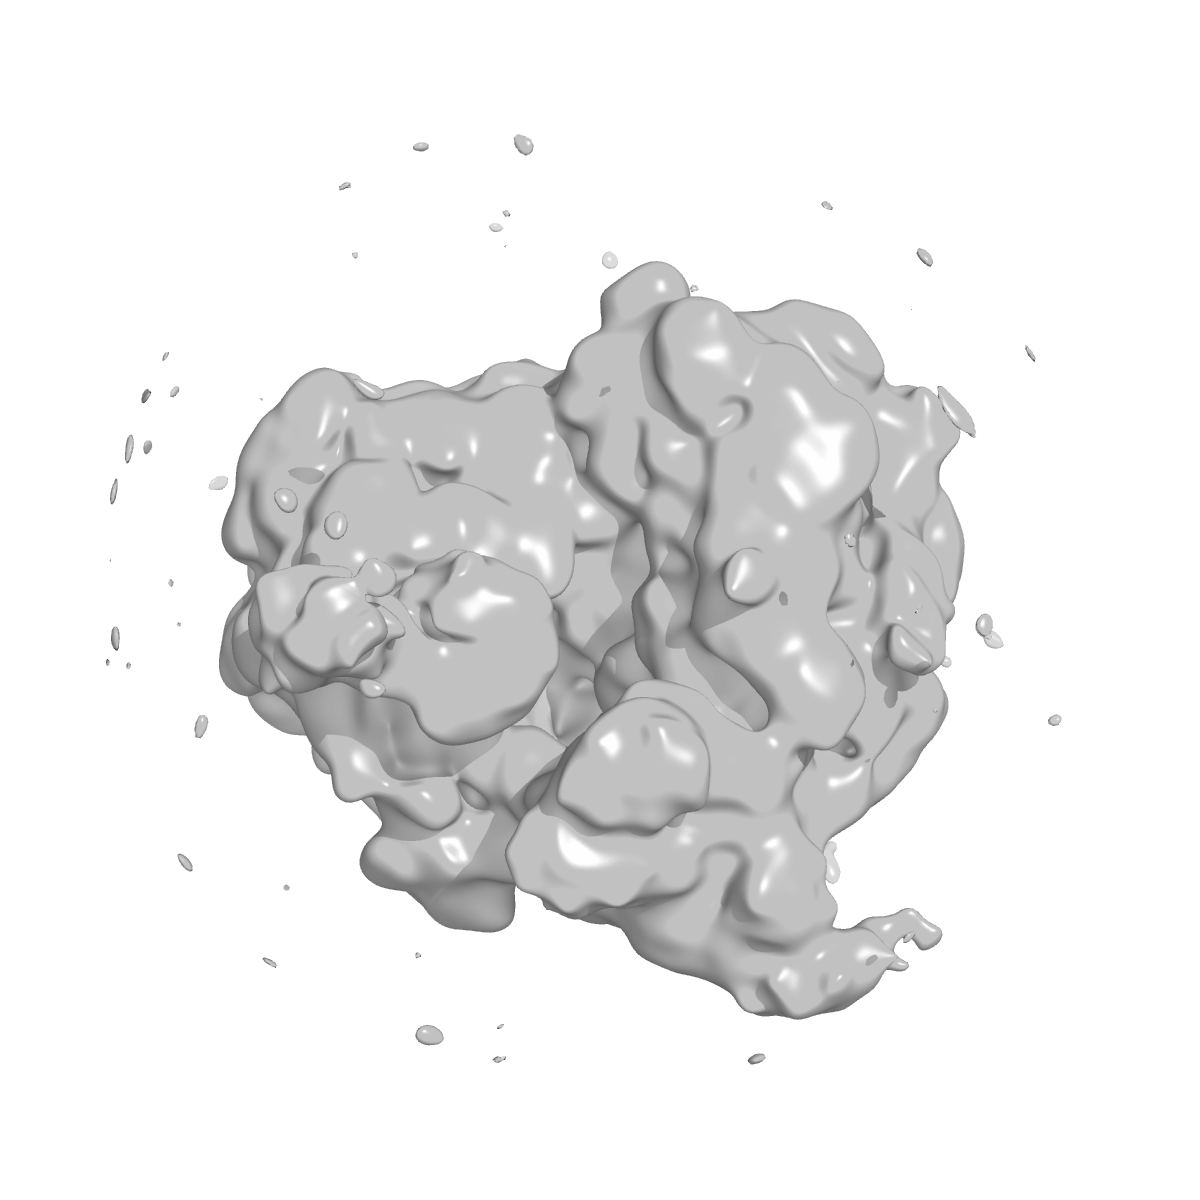
The particles spread fairly evenly across four substantial classes (~19–22% each), all carrying recognizable Plasmodium 80S ribosome density, with two smaller, noisier classes (12% and 5%) absorbing the lower-quality particles. For a homogeneous benchmark like this that even split is the expected, sensible result — the dataset is one ribosome, so RELION distributes it across several near-identical classes rather than finding distinct conformations. The dominant class, up close:
A note on what "9.65 Å" means, because it's easy to over-read:
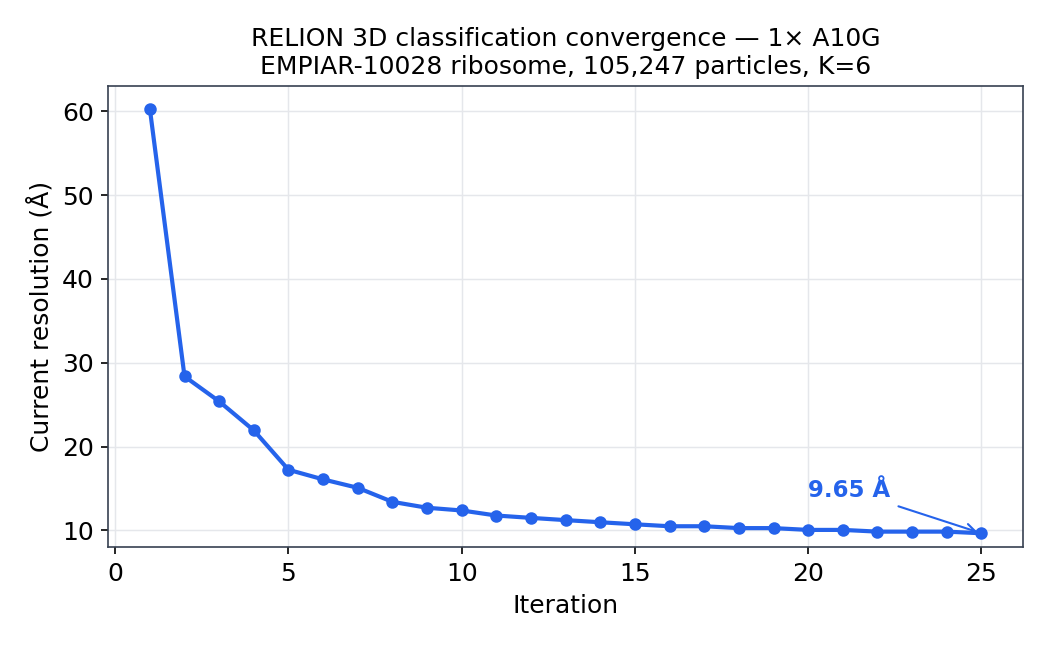
RELION's rlnCurrentResolution for the dominant class improved from 60 Å at iteration 1 to 9.65 Å at iteration 25 as the alignment frequency limit ramped down — but that is the per-iteration alignment limit, not a gold-standard half-map FSC resolution. This benchmark job does no half-map split, postprocessing, or B-factor sharpening, so it doesn't compute an FSC resolution, and we don't quote one. (And at ~10 Å, cryo-EM density is a smooth envelope, not the helical detail of a sub-3 Å map — for that you'd run the refine3d auto-refine path, a different job.) What this does show is that the managed pipeline produced a real, sensible classification — recognizable ribosome density, not fast garbage. The speed numbers only matter because the science underneath is sound.
The operating model: what you actually get
One Slurm submit, GPU passthrough, no build host. The RELION 5 CUDA image is pulled with apptainer pull directly onto the worker (cap-pods can't build, but they can pull), and apptainer exec --nv exposes the host A10G + CUDA. No HPC engineer assembled this; it's a template.
Single-node MPI, inside containerized Slurm — and it just runs. Multi-GPU RELION is MPI: mpirun -n 5 spawns one coordinator + four workers, each pinned to one of the four A10Gs in a single g5.12xlarge. Making OpenMPI launch cleanly inside a containerized slurmd took exactly two things: tell OpenMPI not to reach for Slurm's launcher (--mca plm ^slurm, so it forks ranks locally in the pod), and bind the scratch path so OpenMPI's session directory exists. That's the whole trick. We make no multi-node MPI claim — RELION 5's container is single-node by design, and at this scale single-node multi-GPU is the dominant, recommended path anyway. The differentiation here is managed + spot + in-account, not architecture; AWS PCS and ParallelCluster run RELION too, and we don't pretend otherwise.
Right-sized GPU, measured not guessed — and the answer surprised us. nvidia-smi sampling every 30 s showed the 1× A10G run peaking at 21.5 GB of the card's 23 GB at 100% utilization (37% average — that's the GPU/CPU alternation, not starvation). The consequence is the opposite of our OpenFE FEP workload, where the A10G's VRAM was massively over-provisioned: here, the A10G's 24 GB class is the right floor — a 16 GB card would OOM on this box-360 / K=6 job. Same platform, different workload, different correct instance — because we measure it.
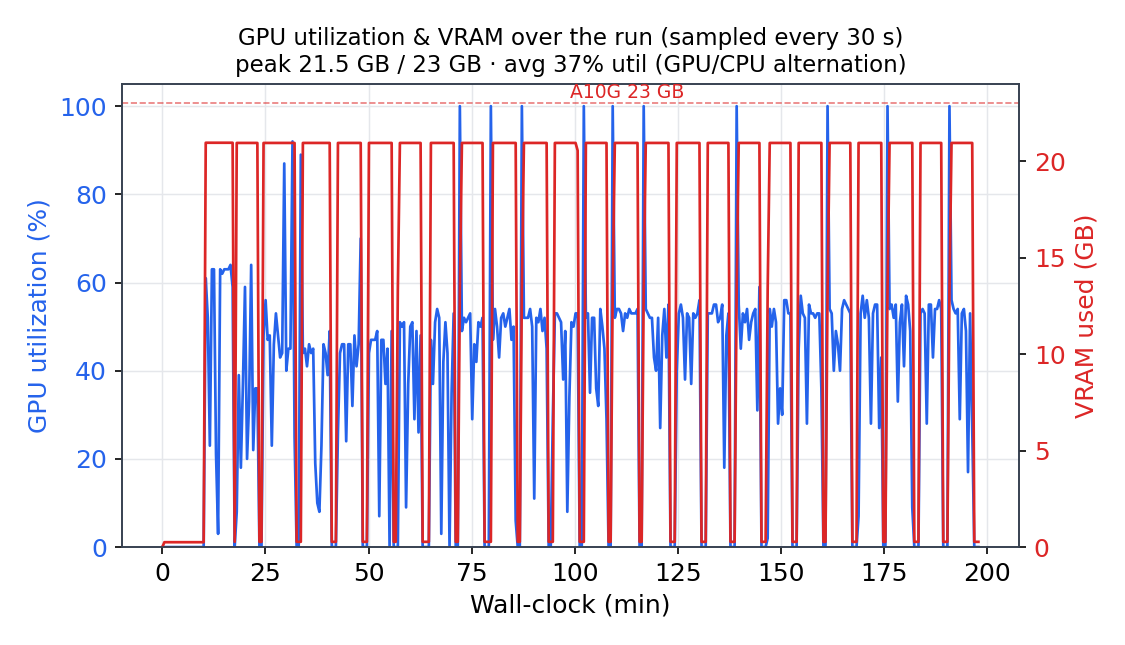
Spot — and an honest gap it exposed. Every run was on spot. The two headline runs completed without interruption, so we're not going to dress this up as a battle-tested resilience story. But a third replicate was genuinely reclaimed and requeued on scarce g5 spot — and because the current RELION template relies on plain Slurm requeue, it restarted from iteration 0, losing ~1.8 h of progress (we abandoned it). That's the real, lived gap: RELION supports --continue <optimiser.star> to resume from the last checkpointed iteration — exactly the spot-safety we already ship for OpenFE (quickrun --resume) — but it is not yet wired into the RELION template. It's a known, queued fix, and the reclaimed replicate is the evidence it matters, not a hypothetical.
Cost, and the crossover that matters to a small lab.
| Config | Instance | ~spot $/hr | wall | ~$/job |
|---|---|---|---|---|
| 1× A10G — as run | g5.4xlarge spot |
~$1.2 | 3.30 h | ~$4.0 |
| 1× A10G — right-sized (projected) | g5.xlarge spot |
~$0.50 | 3.30 h | ~$1.65 |
| 4× A10G | g5.12xlarge spot |
~$2.5 | 1.59 h | ~$4.0 |
Two honest notes on cost. First, the headline runs actually landed on a g5.4xlarge (~$4), not the g5.xlarge — the cap-pod's CPU request was set higher than a GPU-bound RELION job needs, which floors the instance size; the ~$1.65 is the projected cost once we right-size the template (cpus → 3, --j 3), which is a one-line template change we've queued, not a measured result here. Second, even at the as-run $4, the single A10G is the cost-optimal choice: it is roughly the same cost as the 4-GPU box but on cheaper, far-more-available hardware — and the 4-GPU box only buys ~2× wall-clock. For a lab with no standing cluster, the default is one A10G; you pay the multi-GPU premium only when turnaround urgency justifies it.
"Why not just install RELION and run this on my own spot?"
You can — RELION is free and AWS rents the GPUs. What you'd be assembling: a working RELION 5 CUDA image and the apptainer pull path; a Slurm scheduler that provisions A10G spot on demand and tears it down; the mpirun --mca plm ^slurm incantation to make multi-GPU MPI launch inside a container; NVMe scratch routing so EFS isn't your bottleneck; spot-reclaim requeue (and checkpoint-resume so it isn't wasted); GPU right-sizing measured rather than guessed; and the per-job cost stamped in your own account. None of it is exotic. All of it is a week you don't get back, every time you onboard a new workload. And the part you can't pip install is the durable one: every run's parameters, cost, instance, and outputs accreting as a queryable record in the customer's own account — the system-of-record that turns one-off jobs into a campaign history. That's the actual product.
Honest scope (what this run is and isn't)
- Easy benchmark, by design. EMPIAR-10028 is the cryo-EM equivalent of TYK2 for FEP — a well-behaved canonical fixture. It proves the pipeline yields correct, fast, literature-grade results; it does not claim we solve hard, heterogeneous, or novel structures.
- Single-node only. RELION 5's container has no multi-node MPI. We validate single-node multi-GPU MPI; we do not claim (and the workload doesn't need) tightly-coupled multi-node.
- Version caveat. Published comparison numbers are RELION 2/3; ours is RELION 5.0. Same dataset/job-def, different stack — not a controlled hardware delta.
- Resolution caveat. The 9.65 Å figure is
rlnCurrentResolution— RELION's per-iteration alignment frequency limit — not a gold-standard half-map FSC resolution, which this Class3D benchmark job does not compute. - Container provenance. We currently pull the community
jidaniel/relion:5.0-cuda12.6image (single-maintainer Docker Hub). Pinning to a digest and/or building our own RELION-5 SIF from source is queued hardening. - n. Headline 1× A10G is n=2 (~0.5% spread). We attempted n=3; the third replicate was reclaimed and requeued repeatedly on scarce
g5spot and we abandoned it — an honest datapoint on spot scarcity for long single-node jobs, and exactly why--continuecheckpoint-resume is the queued fix. Scaling and CPU are n=1, and the CPU run is a timed-out floor, not a finished baseline.
Reproduce it
- Dataset:
ftp://ftp.mrc-lmb.cam.ac.uk/pub/scheres/relion_benchmark.tar.gz(47 GiB; EMPIAR-10028 pre-extracted particles +emd_2660.map). - Image:
docker://jidaniel/relion:5.0-cuda12.6(RELION 5.0, CUDA 12.6), pulled to a cluster-cached SIF. - Jobs (clusde74): 2983 + 2990 (1× A10G headline, n=2), 2986 (4× A10G), 2987 (CPU baseline — DNF, timed out at the 3 h cap), 2991 (1× A10G rep 3 — reclaimed off spot, abandoned).
- MPI launch:
mpirun --mca plm ^slurm --mca ras ^slurm --oversubscribe --bind-to none -np <N+1> relion_refine_mpi ... --gpuinsideapptainer exec --nv --bind $TMPDIR.
What's next
- A real-world target where there's no published number to hide behind — e.g. a membrane protein (TRPM8, EMPIAR-11233) — to show the managed pipeline on data that isn't the easy fixture.
--continuespot-resume wired into the RELION template, so a reclaim resumes instead of restarting.- The full SPA pipeline as one chained campaign (Class3D → Refine3D → postprocess), the way the OpenFE post runs plan → fan-out → gather.
Run it in your own AWS
RELION cryo-EM refinement — and the rest of your HPC stack — runs on a managed Slurm cluster in your own AWS account: on spot, no cluster to stand up, no data egress. Start at clusterra.cloud, or email hello@clusterra.cloud.