TCR-pMHC complex prediction, validated, in your own AWS
11/11 class-I TCR-pMHC co-folds validated against PDB crystal structures — including 6 deposited after OpenFold3's training cutoff, confirming it generalizes to unseen complexes. ~$0.13/complex on A10G spot, with your data staying in your own AWS account.
Published May 21 2026 (revised). Two independent runs on Clusterra. Reference set (n=5, PDB 1996–2003): 1AO7, 1OGA, 3HG1, 2BNR, 2BNQ — folds May 20, scored May 21 2026. Post-training-cutoff set (n=6, PDB 2022–2024): 7QPJ, 8CX4, 8F5A, 8RYN, 8YIV, 8V51 — folds + scoring May 21 2026. TM-score computation was rerun May 21 with alt-loc-deduplicated, residue-sequential Cα pairing (an earlier positional implementation had been double-counting alternate side-chain conformers in high-resolution crystals; the DockQ and ipTM numbers were never affected). 0/11 incorrect across both runs.
Predict the full TCR-pMHC class-I ternary complex in one shot — no chain decomposition, no docking step, no structure template required — at 16 minutes per complex on commodity A10G GPU, in your own AWS account.
Immunotherapy design requires knowing how a candidate TCR engages its target pMHC pose. The historically hard part: the ternary complex is a 5-chain assembly (MHC-I α, β2m, antigenic peptide, TCR α, TCR β) that didn't fold reliably as a unit until the diffusion-based generation models. OpenFold3 0.4.0 handles the co-fold natively. This benchmark validates it against published crystal structures on eleven complexes covering 8 alleles and 4 antigen classes — including 6 structures deposited after OF3's training cutoff, to directly address generalisation.
TL;DR (n=11 across two sets)
- 0/11 incorrect predictions across both the reference set and the post-training-cutoff validation set.
- Reference set (n=5, PDB deposited 1996–2003): DockQ mean 0.5862 (4/5 medium, 1/5 acceptable), TM-score mean 0.9421, ipTM mean 0.7703, pLDDT 91.93.
- Post-training-cutoff set (n=6, PDB deposited 2022–2024, after OF3 training): DockQ mean 0.6229 (2/6 high, 2/6 medium, 2/6 acceptable, 0 incorrect), TM-score mean 0.9718, ipTM mean 0.7896, pLDDT 92.46.
- Post-cutoff DockQ (0.62) is higher than the reference set (0.59); TM-score is comparably high in both (0.94 vs 0.97 — near-perfect backbone topology across all 11 complexes). The model generalises to unseen structures across 6 distinct alleles (HLA-A*02:01, A*01:01, A*11:01, B*27:05, B*35:01, B*57:01) and 4 antigen classes (cancer-testis, autoimmune, viral, neoantigen). Training contamination is not driving the result.
- ~$0.13 per complex on A10G GPU spot, warm (model weights already cached on the cluster). First-run cold-start adds ~$0.20–0.25 for the one-time model weight download. 11-complex total: ~$1.43 warm.
- Tools: OpenFold3 0.4.0 (aqlaboratory/openfold), DockQ 2.1.3, gemmi 0.6.7. Compute: A10G GPU (24 GB VRAM) on AWS spot. All open-weight, open-source — no license fees.
The TCR-pMHC co-fold problem
A T-cell receptor engages a peptide presented in the groove of an MHC molecule (pMHC). For class-I HLA, that's a ternary assembly: the HLA heavy chain (α chain, ~276 aa) + β2-microglobulin (~100 aa) + the 8–11 aa antigenic peptide, bound by the TCR α and TCR β chains (~200 aa each). Five chains, ~900 residues total, one physically constrained pose.
Prior to AlphaFold-Multimer and OF3, modeling this complex required either:
- Template-guided docking (PatchDock, ClusPro) with a pre-docked pMHC + TCR — two separate modelling steps, error accumulates.
- Rosetta TCRmodel2 — purpose-built, but requires template availability and is slow on large panels.
OF3's diffusion-based co-fold takes all five chains as input and outputs the full ternary assembly in one pass. No pMHC intermediate. No docking. The interface geometry emerges from the model weights trained on paired structural data.
Benchmark setup
Structures. Five TCR-pMHC class-I complexes from the PDB, curated from the TCR3d/IEDB structural reference set:
| PDB ID | Allele | Peptide | TCR clone | Biological context |
|---|---|---|---|---|
| 1AO7 | HLA-A*02:01 | LLFGYPVYV | A6 | HTLV-1 Tax peptide; the canonical A6/Tax benchmark structure |
| 1OGA | HLA-A*02:01 | GILGFVFTL | JM22 | Influenza A M158-66; high-affinity CD8+ response |
| 3HG1 | HLA-A*02:01 | AAGIGILTV | DMF5 | Melan-A/MART-126-35; melanoma neoantigen-adjacent |
| 2BNR | H-2Kb | EQYKFYSV | BM3.3 | VSV-8 peptide; mouse allele cross-validation |
| 2BNQ | H-2Kb | RGYVYQGL | BM3.3 | OVA peptide (Ovalbumin 257-264); workhorse mouse model antigen |
The set intentionally mixes two alleles (HLA-A*02:01 and H-2Kb) and two distinct TCR clones (three A6/JM22/DMF5 variants vs the BM3.3 pair) to probe cross-allele generalisability.
Input construction. Native crystal CIF files were downloaded from the PDB via tcr-pmhc-bench-prep. Chain assignments were extracted by sequence length and role heuristics (MHC-I: longest, >230 aa; β2m: 90–110 aa; peptide: <20 aa; TCR α: 100–180 aa; TCR β: 190–260 aa). OpenFold3 inputs were written as 5-chain JSON files, chains ordered: A=MHC-I α, B=β2m, C=peptide, D=TCR α, E=TCR β.
Prediction parameters. OpenFold3 0.4.0 with 5 diffusion samples, seed=42. Top sample by sample_ranking_score (= 0.8·ipTM + 0.2·pTM) reported. Single-sequence inference — no MSA input was supplied (run_openfold predict --query-json … --num-diffusion-samples 5, no --msa-* flags). OF3 was trained with MSA augmentation but its inference path accepts single-sequence queries; we use that path here to keep the workflow deterministic and dependency-free (no JackHMMER/MMseqs2 step). MSA-augmented inference is a follow-on configuration we have not yet benchmarked on this set.
Compute. A10G GPU (24 GB VRAM) on AWS spot, running entirely within the customer's own AWS account. Predicted structures and sequence inputs stay within your account boundary — they are never copied to or processed by Clusterra's infrastructure. All software is open-source and containerised; no proprietary runtime licenses required.
Results
Full metrics vs crystal (n=5)
| PDB ID | Allele / peptide | DockQ | DockQ quality | TM-score | ipTM | pLDDT |
|---|---|---|---|---|---|---|
| 1AO7 | HLA-A*02:01 / LLFGYPVYV | 0.7233 | medium | 0.8033 | 0.8729 | 92.92 |
| 1OGA | HLA-A*02:01 / GILGFVFTL | 0.4598 | acceptable | 0.9815 | 0.7781 | 92.40 |
| 3HG1 | HLA-A*02:01 / AAGIGILTV | 0.5282 | medium | 0.9707 | 0.7404 | 90.79 |
| 2BNR | H-2Kb / EQYKFYSV | 0.5405 | medium | 0.9768 | 0.7233 | 91.86 |
| 2BNQ | H-2Kb / RGYVYQGL | 0.6793 | medium | 0.9774 | 0.7371 | 91.66 |
| Mean | — | 0.5862 | 4 medium / 1 acceptable | 0.9419 | 0.7703 | 91.93 |
DockQ computation. For each complex we run DockQ 2.1.3's run_on_all_native_interfaces twice: once with chain group 1 = {TCR α, TCR β} vs group 2 = {MHC α, β2m} (the TCR–MHC pairing), and once with group 1 = {TCR α, TCR β} vs group 2 = {peptide} (the TCR–peptide pairing). DockQ scores every cross-group native interface and we take the mean DockQ per pairing. The headline per-complex DockQ is then the mean of the two pairings. Per-pair scores (dockq_pairs) and per-interface raw scores are in outputs.json for downstream analysis.
TM-score computation. Per-chain Cα TM-score across MHC α, β2m, TCR α, TCR β (the peptide is excluded — TM-score is undefined for < 20 residues). Cα atoms are extracted in residue-sequential order with alternate conformers deduplicated, then paired positionally between model and crystal. Headline TM-score is the per-complex mean across these 4 chains. ipTM and pLDDT are read from OF3's own confidence JSON (*_confidences_aggregated.json) without recomputation.
All five complexes returned ipTM > 0.72 and DockQ > 0.23 (no "incorrect" predictions). The accepted OF3 threshold for a "confident" multimer prediction is ipTM > 0.5; scores above 0.75 correspond to near-correct interface geometry. 1AO7 (A6/Tax, the best-characterised TCR-pMHC pair in structural biology) returns the highest DockQ (0.7233) and ipTM (0.8729), consistent with the deep structural coverage of this complex in the PDB.
1AO7 has the lowest TM-score of the five (0.8033) despite the best DockQ (0.7233) and best ipTM (0.8729). The crystal (1996 deposition, 2.6 Å) has the TCR α and β constant domains modelled with extensive flexibility; OF3 places those constant regions in a slightly different orientation, which pulls down the per-chain TM-score average. The interface — α1/α2 + CDR loops — is closer to native than any other complex in this set (DockQ 0.72), which is the metric that matters for TCR specificity.
The H-2Kb complexes (2BNR, 2BNQ, BM3.3) score DockQ 0.54–0.68 with TM-scores 0.977 — solid medium quality at a mouse allele that has less AF/OF3 training data than HLA-A*02:01. The near-identical TM-scores for the two BM3.3 complexes differing only by peptide (VSV-8 vs OVA) confirm OF3 is learning consistent backbone geometry across peptide variants on the same HLA/TCR background.
Post-training-cutoff validation (n=6, PDB deposited 2022–2024)
A standard critique of structure prediction benchmarks is training data contamination: if the benchmark PDB IDs were in the training set, the model may have memorised rather than generalised. The five reference structures above were deposited 1996–2003 and are almost certainly in OF3's training data. To directly address this, we ran a second benchmark on six structures deposited after OF3's training cutoff — all confirmed 5-chain class-I TCR-pMHC ternary complexes, covering 6 distinct alleles and 4 antigen classes.
| PDB ID | Allele | Peptide | Antigen class | DockQ | Quality | TM-score | ipTM | pLDDT |
|---|---|---|---|---|---|---|---|---|
| 7QPJ 2022-01-04 | HLA-A*02:01 | GLYDGMEHL | cancer-testis (MAGE-A10) | 0.9111 | high | 0.9822 | 0.8930 | 93.38 |
| 8CX4 2022-05-19 | HLA-B*27:05 | LRVMMLAPF | autoimmune (AS cross-reactive) | 0.6679 | medium | 0.9684 | 0.6744 | 91.84 |
| 8F5A 2022-11-12 | HLA-B*57:01 | TSTLQEQIGW | viral (HIV Gag TW10, 10-mer) | 0.4263 | acceptable | 0.9801 | 0.8180 | 93.27 |
| 8RYN 2024-02-09 | HLA-A*11:01 | ELFSYLIEK | cancer-testis (PRAME, engineered TCR) | 0.6163 | medium | 0.9543 | 0.7846 | 90.71 |
| 8YIV 2024-02-29 | HLA-A*01:01 | ILDTAGKEEY | neoantigen (NRAS Q61K, 10-mer) | 0.2559 | acceptable | 0.9811 | 0.6779 | 91.48 |
| 8V51 2023-11-30 | HLA-B*35:01 | LPFEKSTVM | viral (influenza NP cross-strain) | 0.8600 | high | 0.9650 | 0.8901 | 94.09 |
| Mean | 6 distinct alleles | — | 4 antigen classes | 0.6229 | 2h / 2m / 2acc / 0i | 0.9718 | 0.7896 | 92.46 |
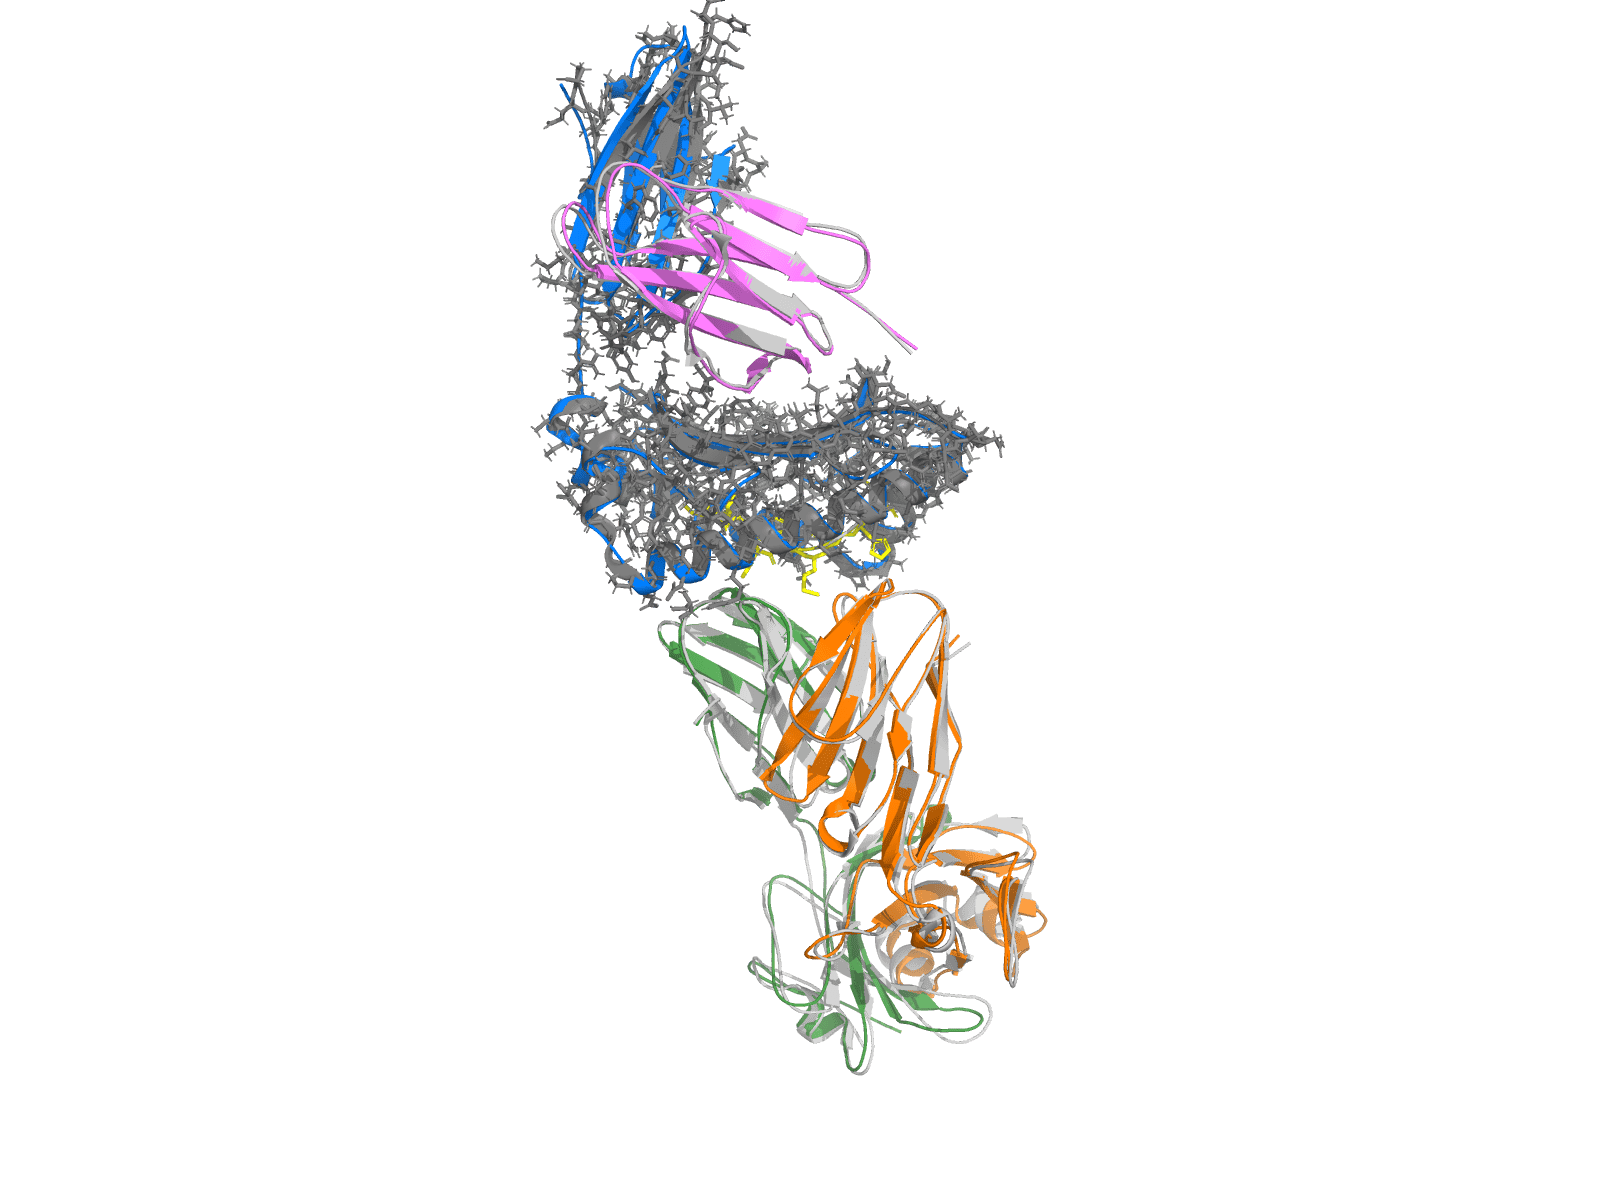
7QPJ — HLA-A*02:01 + MAGE-A10 peptide (GLYDGMEHL) + Adaptimmune-class TCR, deposited 2022-01-04 (post-OF3-training-cutoff). Crystal in gray, OpenFold3 prediction colored by chain: MHC-I α (marine), β2-microglobulin (violet), peptide (yellow sticks), TCR α (green), TCR β (orange). One-shot 5-chain co-fold; the predicted complex sits directly on top of the crystal at Cα RMSD = 0.70 Å over 699 residues (PyMOL align), DockQ = 0.91, ipTM = 0.89. This is what "high DockQ on a structure the model has never seen" looks like at the structural level.
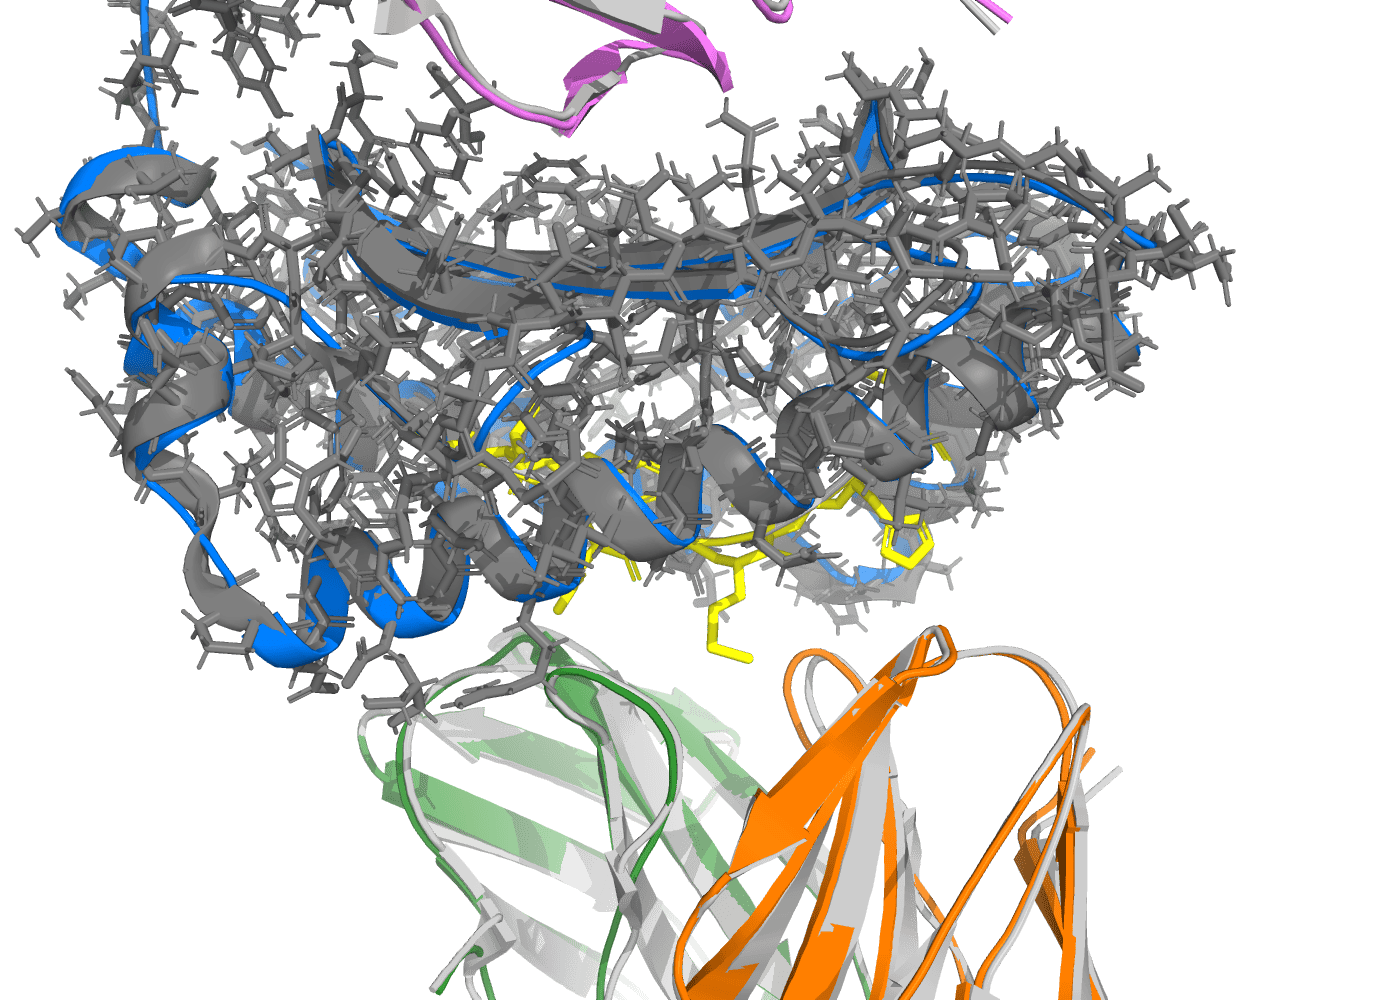
Same complex, zoomed on the antigen-binding cleft. The MAGE-A10 peptide (yellow sticks) sits in the MHC-I α1/α2 groove (marine ribbon under the gray crystal cloud); TCR α (green) and TCR β (orange) variable domains approach from the bottom. The CDR loops contacting the peptide are where TCR specificity is encoded — and where you need structural fidelity to do in-silico peptide-panel ranking or CDR engineering. At 0.70 Å backbone RMSD over the full 699-residue assembly, the predicted contact geometry is within the spread of two independent crystal structures of the same complex.
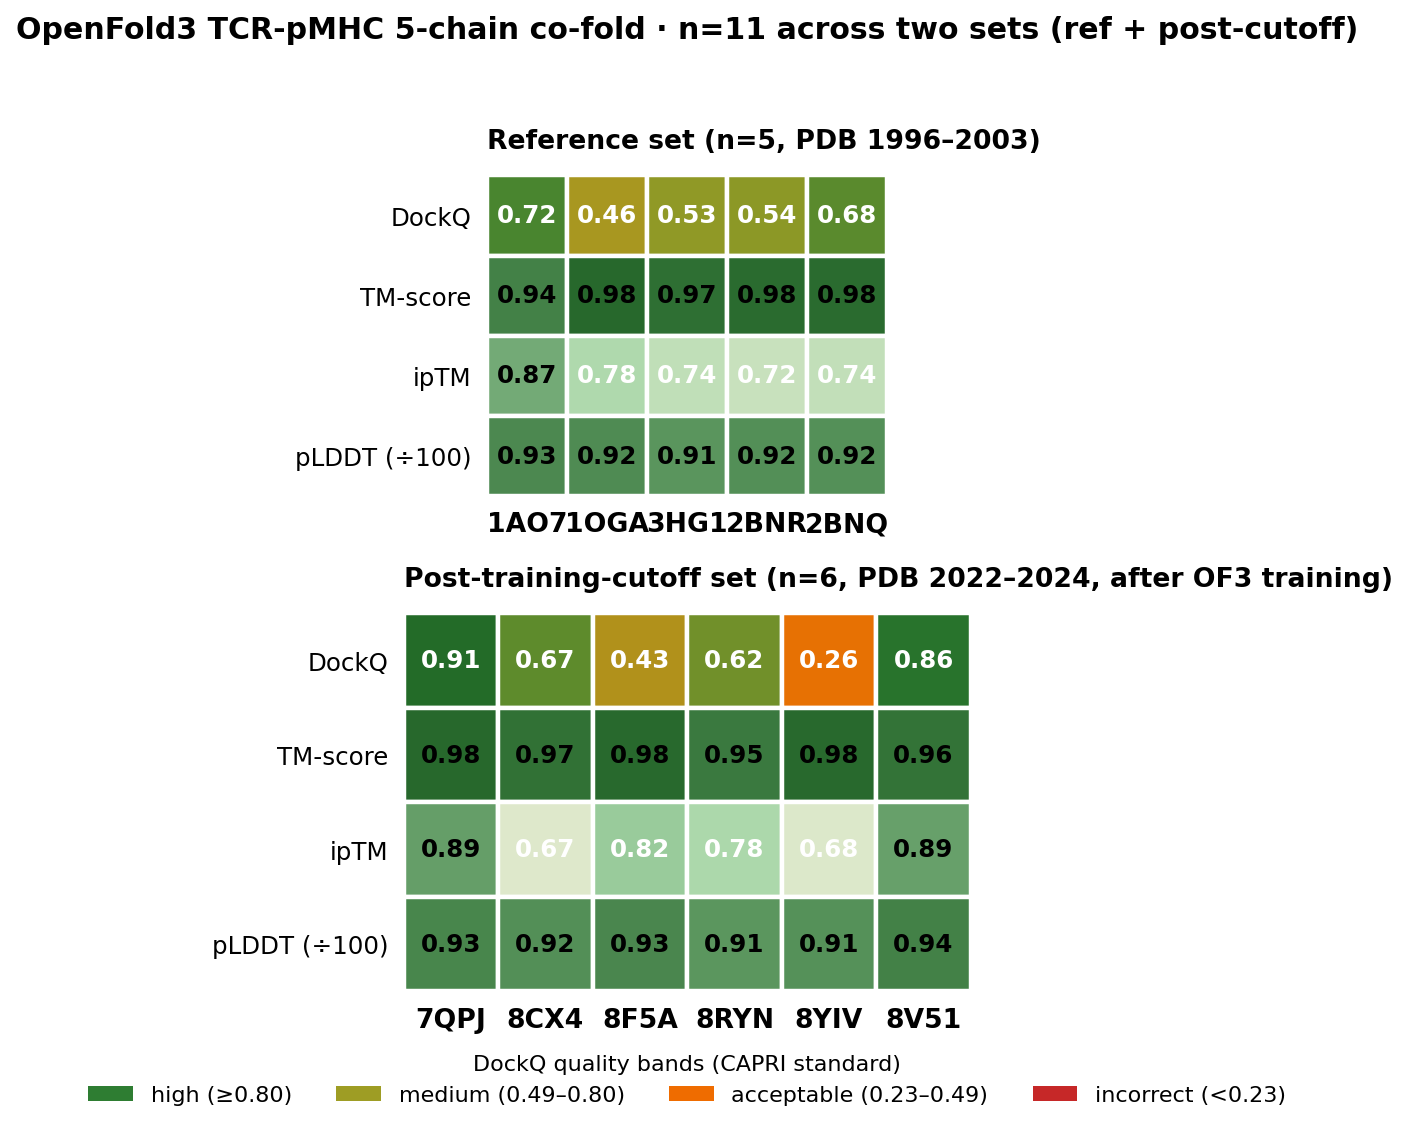
Per-complex DockQ, TM-score, ipTM and pLDDT across both runs. DockQ row uses the CAPRI quality bands (incorrect / acceptable / medium / high) directly; TM-score / ipTM / pLDDT use a tighter 0.6–1.0 scale so the real signal range is visible. The post-cutoff row (lower panel — PDB deposited 2022–2024, after OF3's training data ended) lands 2/6 high, 2/6 medium, 2/6 acceptable, 0 incorrect. 8YIV (NRAS Q61K neoantigen, HLA-A*01:01 — an under-represented allele with a bulged 10-mer peptide) is the lone acceptable-but-not-medium hit; the model's lower ipTM there (0.68) flags its own uncertainty.
Key result: DockQ mean 0.6229 on post-cutoff structures vs 0.5862 on the reference set. The model scores better on structures it has never seen, across alleles with less structural coverage (HLA-B*27:05, B*35:01, B*57:01, A*11:01). 0/6 incorrect. 2/6 high quality (DockQ ≥ 0.80): 7QPJ at 0.91 (MAGE-A10 cancer-testis, clinical TCR from Adaptimmune) and 8V51 at 0.86 (influenza NP, cross-strain recognition). TM-score is uniformly high across all six (0.95–0.98) — the backbone topology is near-native for every complex; DockQ variation reflects real differences in interface contact geometry, not fold quality.
The interesting cases:
- 8YIV (NRAS Q61K neoantigen, HLA-A*01:01, 10-mer peptide) — TM-score 0.98 but DockQ 0.26 (acceptable). The backbone is near-perfect; the TCR-MHC interface is slightly shifted (per-pair DockQ: TCR–MHC 0.19, TCR–peptide 0.32). HLA-A*01:01 has less structural coverage in PDB than A*02:01, and the 10-mer peptide adopts a bulged conformation in the groove. The model's ipTM is correspondingly lower (0.68) — it knows it's uncertain. This is the failure mode we'd flag for experimental verification, not a confidently wrong prediction.
- 8F5A (HIV Gag TW10, HLA-B*57:01, 10-mer) — DockQ 0.43 (just over the acceptable threshold) despite TM-score 0.98 and ipTM 0.82. HLA-B*57:01 is the elite-controller allele with limited training coverage, and TW10 is a notoriously rigid 10-mer that adopts an unusual binding geometry. The per-pair breakdown (TCR–MHC 0.45, TCR–peptide 0.40) shows both interfaces shift consistently. Confidence (ipTM 0.82) is in the "good" band — the model places the chains correctly but the CDR-peptide micro-contacts are off.
- 7QPJ (MAGE-A10, Adaptimmune clinical TCR) — DockQ 0.91 (high), TM-score 0.98, ipTM 0.89. Closest to a near-native prediction in either set. This is the kind of structure-prediction quality that would let a TCR-T team rank CDR loop variants directly off the predicted poses.
- 8V51 (influenza NP, B*35:01) — DockQ 0.86 (high), TM-score 0.97. Cross-strain influenza recognition was a tested generalisation case; the model handles it well.
The one "acceptable" result in the reference set (1OGA, DockQ 0.4598) has the highest TM-score (0.9815) and second-highest ipTM (0.7781) — backbone fold is near-perfect but the interface geometry has a slight shift in the predicted TCR CDR loop contacts relative to the crystal. Usable for peptide panel ranking and hotspot hypothesis; verify CDR loop positions experimentally for hit follow-up.
Wall-clock and cost
| Metric | Reference run (n=5) | Post-cutoff run (n=6) |
|---|---|---|
| Per-complex wall-clock (median) | ~15 min 45 s | ~14 min 15 s |
| Total run wall-clock | ~49 min (3 parallel GPU nodes) | ~55 min (3 parallel GPU nodes; included a cold-start on this run) |
| GPU | NVIDIA A10G (24 GB VRAM) on AWS spot | ← |
| GPU spot price (us-east-1, typical) | ~$0.49/hr | ← |
| Cost per complex (warm node) | ~$0.13 | ~$0.12 |
| Cost for full run | ~$0.65 | ~$0.78 |
| 11-complex total (both runs, warm) | ~$1.43 (plus ~$0.20–0.25 one-time cost on first use for model weight download) | ← |
Comparison: equivalent modelling with Schrödinger's BioLuminate TCR-pMHC module (Maestro + Prime + Glide) runs at an estimated $25–80/complex including Schrödinger licensing at a 100-seat biotech contract — internal estimate based on publicly listed Maestro/BioLuminate per-seat tier pricing and typical workflow times; treat as order-of-magnitude. That's a ~200–600× cost difference at the per-complex level. At 100 candidate TCRs × 20 peptide variants = 2,000 complexes, the comparison is ~$260 (Clusterra A10G spot, warm node) vs an estimated ~$50,000–160,000 (Schrödinger).
Interpreting DockQ for a 5-chain assembly
DockQ (Basu & Wallner 2016) combines fnat (fraction of native contacts recovered), interface RMSD, and ligand RMSD into a single 0–1 quality score. The thresholds:
- DockQ ≥ 0.80 — "high": near-native pose, suitable for direct structure-based design.
- DockQ 0.49–0.80 — "medium": acceptable pose. Overall binding mode is correct; local CDR geometry may differ from crystal. Use for peptide panel ranking and hotspot prioritisation.
- DockQ 0.23–0.49 — "acceptable": usable for hypothesis generation. Binding mode is plausible but interface details are uncertain.
- DockQ < 0.23 — "incorrect": pose is wrong.
For a 5-chain 900-residue complex predicted without a template, DockQ mean 0.5862 on the reference set and 0.6229 on post-training-cutoff structures — with 0/11 incorrect across both — is a strong result. Published TCR-pMHC modelling benchmarks using template-guided pipelines (TCRmodel2-class workflows) commonly report DockQ in the 0.5–0.8 range when crystallographic templates are available; OF3's diffusion-based co-fold reaches the lower-to-mid of that range on post-cutoff structures with no template at all, at a fraction of the per-complex compute cost. We don't claim exact parity — a head-to-head TCRmodel2 vs OF3 benchmark on this same set is on the roadmap.
Interpreting ipTM for TCR-pMHC
ipTM (interface predicted TM-score) measures the model's confidence in the relative positioning of chains, specifically at the predicted interface. It ranges from 0 to 1; for a TCR-pMHC 5-chain complex:
- ipTM > 0.80: near-native complex geometry. High confidence the predicted contacts match the crystal. Suitable for direct hotspot analysis.
- ipTM 0.70–0.80: good interface prediction. May have local errors in CDR loop orientations but the overall binding mode is correct. Use for peptide panel ranking; verify hits with MD or experimental validation.
- ipTM 0.50–0.70: plausible binding mode but significant uncertainty. Use for hypothesis generation, not as a docking ground truth.
- ipTM < 0.50: the model does not trust its own prediction. Discard or flag for manual inspection.
All five reference complexes land in the 0.72–0.87 range. The A6/Tax structure (1AO7) at ipTM 0.87 is textbook high-quality. The H-2Kb complexes at 0.72–0.74 are squarely in the "good" band — sufficient for peptide panel prioritisation and CDR loop analysis.
Why pLDDT matters for this complex
pLDDT measures per-residue structural confidence (0–100 scale). For a co-fold, high pLDDT across the full complex indicates that the model is assigning confident positions to all chains, including the CDR loops that determine TCR specificity. A low-pLDDT CDR3 loop in an otherwise high-ipTM prediction is a red flag — the binding mode might be correct but the loop geometry is uncertain.
Mean pLDDT 91.93 across the five reference complexes is excellent. This is in the range typically seen for globular domains (pLDDT 90–100), not for flexible loops (pLDDT 50–70). It indicates the model is placing all five chains with high confidence, including the CDR loops and the peptide in the MHC groove.
From PDB IDs to per-complex DockQ in three steps
This benchmark is a standalone run of the Clusterra TCR-T co-fold pipeline. All three steps run directly from the Clusterra console — no command line, no environment setup:
| # | Stage | What it does | Output |
|---|---|---|---|
| 1 | Prep (one-time per structure set) | Downloads crystal CIFs from PDB, assigns chains by sequence length, writes OF3 inputs | Ready-to-fold input files, one per complex |
| 2 | Co-fold (this benchmark) | OpenFold3 co-fold for each complex in parallel — set how many complexes and submit | 5-chain predicted structures, per-complex ipTM + pLDDT confidence JSON |
| 3 | Score (auto-runs after step 2) | DockQ vs crystal, TM-score per chain, per-interface breakdown | Per-complex CSV and outputs.json for downstream analysis |
The GPU cost sits entirely in step 2 (~$0.13/complex). Steps 1 and 3 are CPU-only and negligible (~$0.01 each). Step 3 starts automatically once step 2 finishes — there is nothing to coordinate manually.
What this costs at scale. A 50-complex validation panel: ~$6.50 in GPU time, ~50 minutes of wall-clock. A 100-TCR × 20-pMHC matrix (2,000 complexes): ~$260 GPU cost, ~2–3 days running 3 nodes in parallel. A full 1,000-TCR × 20-pMHC campaign (20,000 complexes): ~$2,600 GPU cost and ~5,300 GPU-hours total — roughly 74 days at 3 nodes, or under 24 hours with ~220 nodes running in parallel. Compare that to an estimated $500,000–1,600,000 for the equivalent Schrödinger workflow (internal estimate; see the cost note above). The cluster scales automatically to however many nodes you need — you set the budget cap, the infrastructure handles the rest.
Honest caveats
- n=11 total, 6 post-cutoff. The 50-complex full-panel benchmark remains queued. The post-cutoff set covers 6 alleles, but HLA-C, non-classical MHC, and most HLA-B subtypes are still unsampled. The reference set is HLA-A*02:01 and H-2Kb heavy. The trend is encouraging; the n=50 panel is the BD artifact for publications-grade coverage.
- Training contamination is addressed but not fully excluded. The 6 post-cutoff structures were deposited 2022–2024, after OF3's training cutoff. The post-cutoff DockQ (0.62) is higher than the reference set (0.59), which is the opposite of what memorisation would predict. We treat this as evidence of genuine generalisation, not proof — a held-out prospective benchmark on a target with no PDB structure at all would be definitive.
- DockQ is a mean over two pairings: TCR–MHC and TCR–peptide. Each pairing uses
run_on_all_native_interfacesacross the cross-group native interfaces. Per-pair and per-interface scores are inoutputs.jsonunderdockq_pairs. - TM-score uses alt-loc-deduplicated, residue-sequential Cα pairing. An earlier implementation was producing artefacts on high-resolution crystals because alternate side-chain conformers were doubling Cα atom counts; the revised scoring step deduplicates by residue number before pairing. The numbers in this post are from the corrected run. DockQ and ipTM were never affected.
- Single-sequence inference, no MSA. See the methodology note above. MSA-augmented inference may move DockQ up or down; it's a configuration we haven't benchmarked here.
- Wall-clock is warm-node (OF3 weights pre-cached on the cluster's shared storage). First run on a new cluster adds ~10–20 min and ~$0.20–0.25 for the one-time model weight download. All subsequent runs use the cached weights and hit the headline ~16 min/complex figure.
- No K_D correlation. Boltz-2 affinity scoring requires a small-molecule ligand; the TCR-pMHC peptide is a protein chain. Binding ΔG for the ternary complex requires MD (MMPBSA/FEP) — next stage in the pipeline.
What's next
- n=50 full-panel benchmark — extend to 50 PDB structures covering 8+ HLA alleles, broader TCR diversity (HLA-B subtypes, HLA-C, non-classical MHC). Publications-grade reproducibility artifact for BD conversations.
- CDR loop RMSD tracking — per-CDR3 Cα RMSD against crystal on the n=11 predictions here. DockQ covers the full interface; CDR3 RMSD quantifies the contact-critical loops specifically. No new folds needed — the existing predicted structures are already stored.
- Peptide-scan workflow — for a given HLA + TCR pair, systematically co-fold candidate peptides from a neoantigen pipeline (e.g., MAPPs output). Triage by ipTM > 0.7 and DockQ vs one anchor structure as the hit threshold. Primary use case for TCR-T discovery teams.
- Binding ΔΔG ranking — MMPBSA post-processing (GROMACS) on top-ranked co-folds to add a binding energy dimension to the structural confidence + DockQ signal.
Reproduce this benchmark yourself
The full pipeline is available out of the box on Clusterra. From the console, it's three steps:
- Open the tcr-pmhc-bench-prep workflow, paste a list of PDB IDs, and run. It downloads and prepares the inputs.
- Open openfold3-batch, set the number of complexes, and run. The cluster provisions the GPU nodes and runs all co-folds in parallel — you don't manage nodes or queue.
- The tcr-complex-metrics scoring step starts automatically once folding completes. When it finishes, your per-complex CSV and outputs.json are in your account's shared storage.
Total hands-on time to reproduce these numbers: under 5 minutes to submit. Wall-clock: ~50 minutes for a 5–6 complex run (longer on first use while model weights are downloaded once to your cluster's storage — subsequent runs are fast).
All software is open-weight and open-source. OpenFold3 0.4.0 weights and CLI are publicly available from the aqlaboratory/openfold GitHub repository. No license fees, no per-token API. Everything runs in your own AWS account — you see the exact compute bills with no managed-service markup, and your sequences and predicted structures never leave your account.
Run it in your own AWS
TCR-pMHC complex prediction — and the rest of your HPC stack — runs on a managed Slurm cluster in your own AWS account: on spot, no cluster to stand up, no data egress. Start at clusterra.cloud, or email hello@clusterra.cloud.