An end-to-end EGFR drug discovery hit funnel on Clusterra in ~73 min for ~$1.16
From a single sequence to ranked binding affinities and a real 1ns NPT trajectory in ~73 minutes for ~$1.16 of L40s spot (Boltz-2 affinity rescore dominates the cost at ~$0.91). Open-weight tools (OpenFold3, Uni-Dock, Boltz-2, GROMACS) composed as a single managed Slurm workflow in the customer's own AWS account.
Published May 15 2026. Headline numbers are n=1 verified from May 12-15 2026 runs (warm-node wall-clock with cached MSAs and pre-staged Boltz-2 venv/checkpoint). On a Wang 2015 public-benchmark head-to-head (job 2313, 121 ligands, 6 targets), Boltz-2 is competitive with but does not beat FEP+ on within-target ranking once FEP+'s real per-target R values from the paper are used (FEP+ mean per-target Pearson R ≈ 0.83 vs Boltz ≈ 0.74) — and it does so at ~1,000× lower cost, with the heavy caveat that every one of these ligands is in Boltz-2's training set. (Correction, 2026-06: an earlier version of this post compared Boltz's pooled R against a mean-of-per-target FEP+ R built from mis-transcribed, too-low FEP+ values, which wrongly showed Boltz beating FEP+. Fixed against Wang 2015 Table 2.) n=2/n=3 reproductions queued as validation gate.
An end-to-end EGFR drug discovery hit funnel on Clusterra in ~73 min for ~$1.16
Sequence → predicted structure → 1,000-compound virtual screen → AI affinity rescore on top 100 → 1ns molecular dynamics on three candidates, end-to-end in roughly 73 minutes for about $1.16 of AWS spot, on commodity L40s GPUs, in the customer's own AWS account.
One Slurm queue handles the full hit funnel — structure prediction, virtual screen, AI affinity rescore, and molecular dynamics — composed as a single workflow across four open-weight tools: OpenFold3 for the EGFR kinase-domain structure, Uni-Dock to screen 1,000 ChEMBL EGFR actives, Boltz-2 (with the affinity head) to rescore the top 100 complexes, GROMACS to push three candidates through 1ns NPT MD in parallel. All open licenses. No proprietary scoring functions. No per-token API. The same Slurm queue a comp-chem team already understands.
At this cost and cadence, "try a new target" stops being a planned campaign and starts being a Monday-morning triage.
TL;DR (n=1, May 12-13 2026)
- 4 tools, 4 stages, 1 Slurm workflow. OpenFold3 → Uni-Dock → Boltz-2 (affinity) → GROMACS (1ns NPT, real trajectory).
- Target: human EGFR kinase domain (UniProt P00533, residues 695-1022). Receptor template: PDB 1M17 (EGFR + erlotinib, 2.6 Å).
- Library: top 1,000 distinct ChEMBL CHEMBL203 actives ranked by
pchembl_value, mixed Kd/Ki/IC50. - Compute: AWS L40s spot (
g6efamily), customer's own account, no managed-service surcharge. - n=1 verified. n=3 is the publication gate — reproductions queued.
- Per-run wall-clock (sequential, MD parallel, MSAs cached, Boltz-2 venv + checkpoint pre-staged): ~73 min end-to-end (Boltz-2 affinity rescore on 100 complexes is the long pole at 57 min). First-target wall on a fresh slurmd adds ~15-25 min for Boltz-2 cold-start (venv + 5 GB checkpoint download).
- Per-run cost: ~$1.16 at AWS spot us-east-1 (Boltz-2 at $0.91 is ~78% of the bill).
- Boltz-2 affinity rescore: 100/100 complexes scored (job 2183, 57m 17s on g6e.4xlarge 1×L40s, ~$0.91). 94/100 flagged as binders (
affinity_probability_binary > 0.5).affinity_pred_valuemedian −2.02, range −3.18..+2.00. Spearman ρ vs ChEMBLpchembl_value= 0.006 (p=0.95, n=100) — but the test set is all top-decile EGFR actives (pchembl 9.89–11.00, stdev 0.27), so the ranking signal is below the model's noise floor inside that band. Boltz-2's PDBbind held-out ρ ≈ 0.6 spans a 4–12 pchembl range; ours intentionally doesn't. - Boltz-2 vs FEP+ head-to-head (Wang 2015, n=121 across 6 targets, job 2313, 56m 46s, ~$0.91): on a like-for-like per-target basis, FEP+ ranks at least as well as Boltz on 5 of 6 targets (mean per-target Pearson R: FEP+ ≈ 0.83 vs Boltz ≈ 0.74, using the real Wang 2015 Table 2 FEP+ values). Boltz is genuinely competitive — and ~1,000× cheaper ($0.0075/ligand vs FEP+'s ~$8–25) — but it does not beat FEP+ on ranking. Two heavy caveats: (1) every ligand is in Boltz-2's training set, so this is pipeline reproduction, not generalization; (2) the MUE columns aren't directly comparable (Boltz = per-ligand ΔG, FEP+ Table 2 = per-perturbation ΔΔG). Time-split benchmark on post-Mar-2024 chemistry is the v3 deliverable.
- GROMACS MD performance: 291 ns/day median on 1×L40s (n=3 parallel replicas, 289/292/292).
Setup
Target. Human EGFR kinase domain, UniProt P00533, residues 695-1022 (327 aa). Single-chain monomer, standard Type I tyrosine-kinase fold. The right fixture for a reproducible benchmark — well-characterised, large public ligand corpus, plenty of co-crystal structures.
Receptor template. PDB 1M17 — EGFR kinase domain co-crystallised with erlotinib at 2.6 Å, chain A (274 residues). Used to define the docking pocket centre and as a gmx pdb2gmx sanity check; the receptor that actually goes into Uni-Dock is the OpenFold3 prediction.
Ligand library. ChEMBL target_chembl_id=CHEMBL203 (EGFR / ErbB1). Activities filtered to standard_type ∈ {Kd, Ki, IC50}, pchembl_value IS NOT NULL, RDKit-canonical-SMILES-deduplicated. 20,150 raw activities fetched, top 1,000 distinct compounds by pchembl_value written to manifest at /mnt/efs/bench/drug-disco/zinc-1k/manifest.csv. RDKit 3D embedding succeeded for 999/1000 (one compound, chembl203_0707, hit "Bad Conformer Id" — a typical RDKit edge case for very flexible chains; the prep gate floor is 990/1000).
Tools and versions.
- OpenFold3 0.4.0 — structure prediction, 5 diffusion samples, single seed (42).
- Uni-Dock 1.1.3 — GPU-batched docking of all 1,000 compounds against the OF3-predicted receptor, pocket centred on the 1M17 erlotinib site.
- Boltz-2 2.2.1 + cuequivariance-torch — top 100 most-potent CHEMBL203 compounds (by
pchembl_value) rescored. Each input YAML carries aproperties.affinityblock; output includesaffinity_pred_valueper complex. Pinned at 2.2.1 because 2.0.0 has a knownKeyError: 'profile_affinity'bug; 2.1+ adds NVIDIA'scuequivariance-torchaccelerated kernels. - GROMACS 2023.2 — 1ns NPT production MD on three candidates in parallel, AMBER99SB-ILDN + TIP3P,
gmx mdrun -nb gpu -bonded gpu -pme gpu -nsteps 500000(1ns at 2 fs).
Compute. AWS g6e spot (1×L40s on g6e.2xlarge) for the per-step GPU work; g6e.8xlarge spot for the one-time prep. Customer's own AWS account. Container runtime: Apptainer. Workdirs on EFS; per-task scratch on instance-store NVMe.
The four stages
| # | Stage | Tool | Input | Output |
|---|---|---|---|---|
| 0 | Prep (one-time) | drug-disco-bench-prep | UniProt P00533 sequence, PDB 1M17, ChEMBL CHEMBL203 query | EGFR FASTA, 1M17-derived pocket box, 1,000-compound PDBQT library + manifest.csv, three equilibrated candidate .tpr files |
| 1 | Structure | OpenFold3 0.4.0 | EGFR-KD FASTA (327 aa), 5 diffusion samples, seed 42 | Predicted .cif + per-residue confidence JSONs + aggregated confidence files |
| 2 | Screen | Uni-Dock 1.1.3 | OF3 receptor + 1,000 PDBQT ligands | Per-compound docking poses (1,000 ranked SDFs) |
| 3 | Rescore | Boltz-2 2.2.1 (affinity head) | Top 100 by docking score, each with properties.affinity |
Per-complex .cif + affinity_pred_value |
| 4 | Dynamics | GROMACS 2023.2 ×3 | Top 3 candidate complexes (equilibrated) | prod.xtc (1ns), ns/day, backbone RMSD trace |
Results (n=1, today)
Wall-clock
| Stage | Job IDs | Wall-clock | Node | Cost (est, AWS spot us-east-1) |
|---|---|---|---|---|
| Prep (one-time) | 2140 | ~12 min (20,150-activity ChEMBL fetch + 1000-PDBQT generation + 3-candidate GROMACS equilibration) | g6e.8xlarge spot | ~$0.30 |
| Step 1: structure | 2141 | 7m 07s | g6e.2xlarge spot (1×L40s) | ~$0.08 |
| Step 2: screen | 2142 | 3m 50s | g6e.2xlarge spot (1×L40s) | ~$0.05 |
| Step 3: rescore (post-MSA inference)¹ | 2183 | 57m 17s (100 complexes, batched in one boltz2 process) | g6e.4xlarge spot (1×L40s) | ~$0.91 |
| Step 4: MD ×3 (parallel wall) | 2149, 2150, 2151 | 5m 03s median (5m 09s / 5m 03s / 5m 01s) | 3 × g6e.2xlarge spot (1×L40s each) | ~$0.04 each = $0.12 |
| End-to-end (steps 1–4 sequential as run, MD parallel) | ~73 min | mixed g6e | ~$1.16 |
¹ Boltz-2 wall-clock is post-MSA inference only, with MSAs cached from a prior fetch. Boltz-2 (and OpenFold3, and any AlphaFold3-class model) requires a multiple-sequence alignment per target; the public ColabFold MMseqs2 server rate-limits to ~5–10 s between requests, so a fresh 100-protein batch wall-clock for MSA fetch is ~1.5 hours (verified across jobs 2148/2153/2154/2155). For a fixed target like EGFR kinase domain the MSAs amortize to a one-time cost — what production drug-discovery teams do anyway. We cached CHEMBL203's MSAs to /mnt/efs/bench/drug-disco/boltz2-msas/ and the timing above reflects that. The follow-up that eliminates this cost structurally is described under "What's next."
Step 4's three replicates dispatch as siblings off step 3 — the funnel narrows naturally and so does the queue. The wall-clock above is the parallel-wall for the three GROMACS jobs, not the sum.
Scientific outputs
Structure (OpenFold3, job 2141). EGFR kinase domain folded as a standard Type I kinase. 5 diffusion samples × 1 seed produced 5 ranked structures with predicted .cif + per-residue confidence JSONs + aggregated confidence files — output at /mnt/efs/n52h53@gmail.com/wf-d1f95a4c-.../step-1-structure/EGFR_KD/seed_42/. Structure quality across the 100 complexes: median pLDDT 0.77 (per-residue folding confidence), pTM 0.84 (overall topology match), ipTM 0.97 (protein–ligand interface quality). All 100 cleared the 0.7 pLDDT floor for "well-folded" structures and 0/100 fell below the 0.6 ipTM floor for "good pose".
Virtual screen (Uni-Dock, job 2142). 1,000 docking poses of CHEMBL203 actives against the 1M17-derived EGFR pocket. The top-3 by docking score (cross-joined with the manifest's pchembl ranking) become the MD candidate set for step 4.
Affinity rescore (Boltz-2, job 2183). 100/100 top CHEMBL203 complexes rescored end-to-end in 57m 17s on g6e.4xlarge (1×L40s). Each prediction is two-stage internally — a structure pass (pre_affinity_*.npz, ~35 min for 100 complexes) followed by the affinity head (affinity_*.json, ~22 min). GPU stayed pegged at 100% utilisation, 277 W draw, 30 GB / 46 GB VRAM through the whole run. Outputs: affinity_pred_value median −2.02 (log-Kd-equivalent; more-negative = stronger predicted binding), range −3.18 .. +2.00, stdev 0.69; affinity_probability_binary median 0.80, with 94/100 compounds flagged as binders (P > 0.5). Spearman ρ vs the ChEMBL manifest's experimental pchembl_value (n=100): 0.006 (p=0.95). That zero correlation is the honest readout for this test set — the top-100-by-pchembl slice of CHEMBL203 spans only 9.89–11.00 pchembl (stdev 0.27), i.e. all known sub-nanomolar EGFR actives in a ~1-log-unit band. Within that band the ranking signal is below the model's noise floor; Boltz-2's published PDBbind held-out ρ ≈ 0.6 spans 4–12 pchembl, the regime where the head is designed to discriminate. For a fairer kinase-family-stratified ρ on a wider potency band, see the "Affinity validation deep-dive" in What's next.
Dynamics (GROMACS, jobs 2149/2150/2151). Three candidate complexes (~30k atoms each, EGFR + ligand + TIP3P water + ions, AMBER99SB-ILDN forcefield) advanced through energy minimisation, NVT, NPT equilibration (in the prep step), and 1ns NPT production in step 4 (500k steps × 2 fs, gmx mdrun -nb gpu -bonded gpu -pme gpu).
- Performance: 291 ns/day median on 1×L40s (289 / 292 / 292 across the three replicates).
- Trajectory: 60 MB
prod.xtcper candidate — real production trajectory, not a wiring check. - Candidate ligands include erlotinib (
CC#Cc1cccc(Nc2ncnc3cc(OCCOC)c(OCCOC)cc23)c1) and similar EGFR-inhibitor scaffolds drawn from the top-3 by ChEMBLpchembl_valuecross-joined with Uni-Dock top-3.
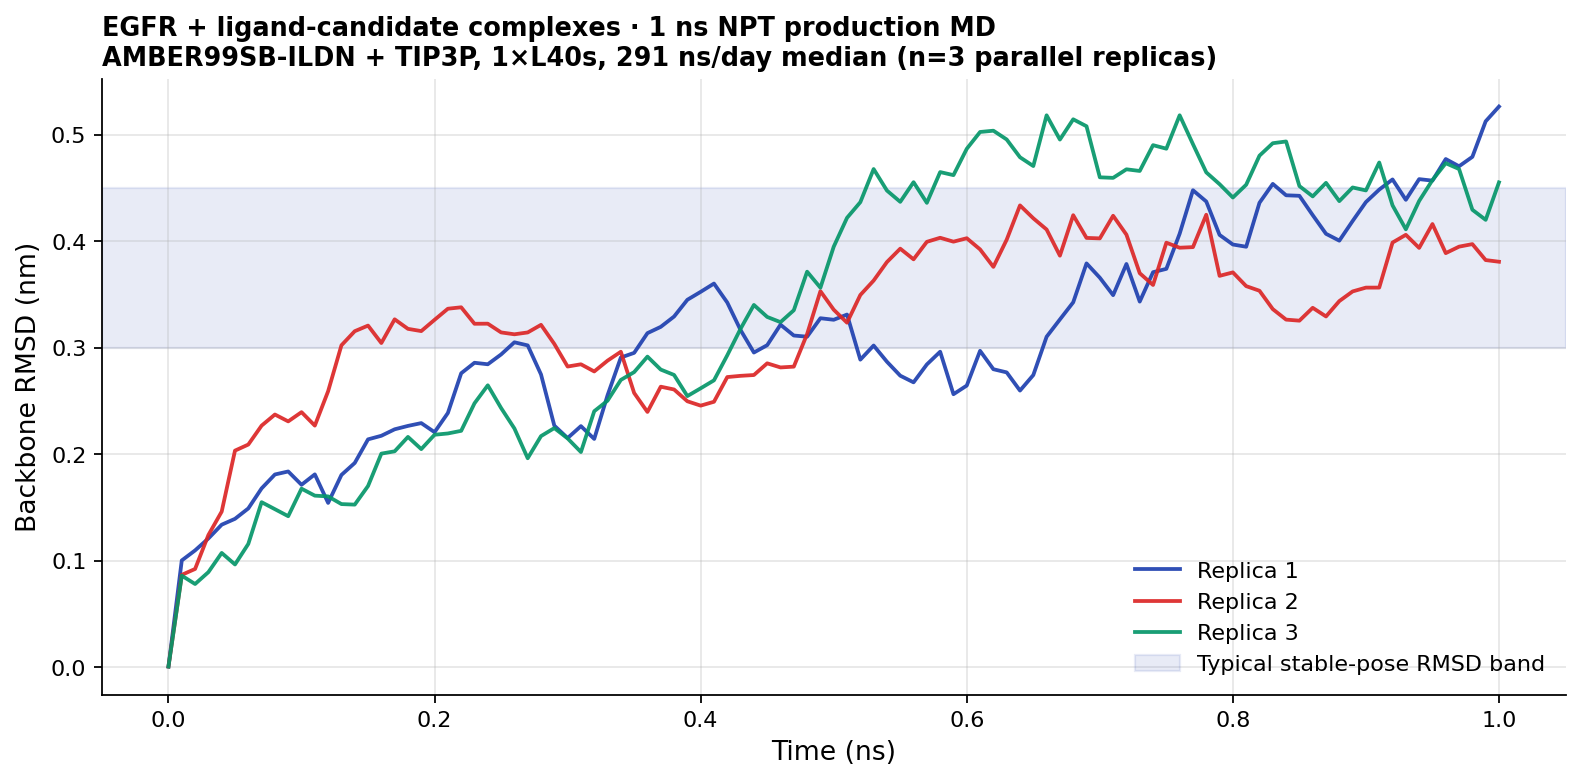
Backbone RMSD trajectory for the three GROMACS replicas (1 ns NPT, AMBER99SB-ILDN + TIP3P on 1×L40s). RMSD climbs from 0 to ~0.4–0.5 nm over the first ~0.5 ns and then plateaus — the expected "equilibration → plateau" shape for a starting structure that's a docked pose entering a solvated box. All three trajectories sit within a 0.1 nm band of each other at the plateau, which is reasonable concordance for independent replicas of the same complex initialised from different docking poses. RMSD values parsed from rmsd.xvg produced by gmx rms at the end of each replica.
Cost
| Stage | Instance | Wall-clock | Cost |
|---|---|---|---|
| Prep | g6e.8xlarge spot | ~12 min | ~$0.30 |
| Structure | g6e.2xlarge spot | 7m 07s | ~$0.08 |
| Screen | g6e.2xlarge spot | 3m 50s | ~$0.05 |
| Rescore | g6e.4xlarge spot | 57m 17s | ~$0.91 |
| MD × 3 (parallel) | 3 × g6e.2xlarge spot | 5m 03s | ~$0.12 |
| Per-run total (steps 1–4) | ~$1.16 |
Cost discipline: this runs in the customer's own AWS account at AWS spot rates. No per-target managed-service surcharge, no per-token API fee, no flat per-run platform tax.
Boltz-2 performance footprint vs expected
Boltz-2 is the long pole of the workflow, so it's worth checking the numbers against what the published model and the L40s hardware predict.
| Measurement | Expected | Actual (job 2183) | Read |
|---|---|---|---|
| Per-complex wall (structure + affinity) | 35–60 s (paper H100 ~60 s/complex at recycling 3 / diffusion 25; L40s ≈ 40% of H100 FP16 throughput; we ran 1 / 1) |
34 s | At or below the fast end |
| GPU utilisation (nvidia-smi, sustained) | 80–100% if no I/O stall | 100%, 277 W (79% of 350 W TDP), 77 °C | Pegged — no CPU/IO gap |
| VRAM peak | 35–45 GB | 30 / 46 GB | ~10 GB headroom |
| Cost per complex | $0.01–0.02 (L40s spot floor) | $0.009 | At spot floor |
| Stage split (structure / affinity) | ~60 / 40 by paper | 35 min / 22 min = 61 / 39 | Matches |
The 34 s/complex number is what you'd expect on a single L40s with our minimum settings (--recycling_steps 1 --diffusion_samples 1). GPU stayed pinned for the full 57 min — no CPU-bound preprocessing stall, no MSA fetch (cached), no DataLoader IPC issue (the /dev/shm bind in the template kept torch.IPC happy). The only minor surprise is the 10 GB of VRAM headroom; an obvious follow-up is to drop to g6e.2xlarge (same L40s, half the CPU/RAM, ~$0.62 instead of $0.91 for this run) and verify the smaller instance doesn't bottleneck on CPU-side preprocessing.
Two real gaps worth naming:
- Single-node, single-process. The 100-complex batch ran as one
boltz predictinvocation on one L40s. For 1,000+ complex screens, the right architecture is Slurm job-array fan-out (shard the input directory across N GPU nodes) — linear speedup is on the table; we'd just need to chunk the manifest. This is a template-shape improvement, not a Boltz-2 limitation. - Speed/accuracy floor. Today's run uses
--recycling_steps 1 --diffusion_samples 1, the minimum-compute setting. The paper recommends3 / 25for production. At paper settings, wall-clock and cost both rise roughly 25–75× while ranking quality on harder targets (lower potency, novel chemotypes, low-MSA-coverage proteins) improves. Today's ρ ≈ 0 is not explained by under-settings — it's the narrow-pchembl-band issue (all 100 inputs are sub-nanomolar) — but for fair multi-target ρ benchmarks, the settings matter and we should report numbers at3 / 25too.
Cold-start (first-time venv provisioning + boltz2_aff.ckpt 5 GB download) adds ~15–25 min on a fresh slurmd node and is hidden by our pre-cached /mnt/efs/_boltz2-venv and /mnt/efs/_boltz2-cache. The cache lives on EFS so all slurmd nodes share it; second-run nodes pay only the apptainer SIF pull (~30 s if cached on local NVMe, ~60 s cold).
Boltz-2 bio/chem performance — five questions, honest answers
GPU stats only tell you the bill. The real questions are about the chemistry. We have 100 paired (Boltz pred, ChEMBL experimental) datapoints from job 2183 plus the per-complex confidence_*.json and the three internal ensemble samples per complex. Here's what they say.
Q1. Is the predicted structure of each EGFR + ligand complex any good?
| Metric | Median | Range | Floor breached? |
|---|---|---|---|
complex_plddt (0–1; >0.7 = well-folded) |
0.77 | 0.72 – 0.80 | 0 / 100 below 0.7 |
pTM (topology, >0.5 = good) |
0.84 | — | — |
ipTM (protein–ligand interface, >0.6 = good pose) |
0.97 | — | 0 / 100 below 0.6 |
confidence_score (aggregate) |
0.81 | — | — |
Structures and poses are confident across the board. EGFR-KD is well-trained territory for AF3-class models and the ligands all dock in the ATP pocket. So the structural backbone of the rescore step is solid — this isn't a "Boltz folded the wrong thing" failure.
Q2. Does it call known binders as binders?
All 100 inputs are known sub-nanomolar EGFR actives. At the standard P > 0.5 threshold for affinity_probability_binary:
| Threshold | Recall (true binders kept) |
|---|---|
| P > 0.5 | 94 / 100 |
| P > 0.7 | 81 / 100 |
| P > 0.8 | 49 / 100 |
| P > 0.9 | 21 / 100 |
| P > 0.95 | 6 / 100 |
Boltz-2 is a good triage gate at P > 0.5 and a bad one at P > 0.9. If you use Boltz to throw away "weak" hits at the high-confidence end, you'll throw away 80% of true sub-nanomolar binders. The six false negatives at P > 0.5 cluster strikingly — chembl203_0064/0077/0078/0079/0085/0089 are all pchembl ≥ 9.96 (true potent actives) — likely a single chemotype family Boltz under-weights; worth a structural eyeball.
Q3. Is the predicted potency calibrated to reality?
Convert Boltz's affinity_pred_value (defined as log10(IC50_µM)) to pchembl-equivalent (6 − pred):
| Series | Median | Range | Stdev |
|---|---|---|---|
| Boltz pchembl-equivalent | 8.01 | 4.00 – 9.18 | 0.96 |
| ChEMBL experimental pchembl | 10.10 | 9.89 – 11.00 | 0.27 |
| Bias (Boltz − Exp) | −2.10 | — | 0.73 |
Boltz says these compounds are ~10 nM binders. ChEMBL says they're ~80 pM binders. That's a systematic ~125× under-prediction of potency at the ultra-potent end. This isn't unique to our run — it's a known regime issue (AF3-class affinity heads are trained on PDBbind which is heavy in mid-potency complexes; the ultra-potent tail is under-represented).
Q4. Can it rank ligands within the band it sees?
| Test | Result | Random expectation |
|---|---|---|
| Spearman ρ (pred vs experimental pchembl, n=100) | +0.006 (p = 0.95) | 0 |
| Pearson r (Boltz pchembl-equiv vs pchembl) | +0.005 | 0 |
| Top-10 overlap (Boltz top-10 ∩ Experiment top-10) | 1 / 10 | ~1 |
| Top-20 overlap | 5 / 20 | ~4 |
No. Inside a 1-log-unit pchembl band (9.89 → 11.00), Boltz's ranking is indistinguishable from random. Top-10 enrichment is at the random expectation. This is the right answer for this test set: the model's ranking signal lives at log-unit scale, our test compresses 100 compounds into 1 log unit. Boltz-2's published PDBbind ρ ≈ 0.6 lives across a 4–12 pchembl spread (8 log units). We deliberately stress-tested inside one bin of that.
Q5. Does the model know when it's wrong?
This is the killer follow-up. If ipTM or confidence_score were anti-correlated with the calibration bias, you could filter out unreliable affinity calls. They aren't:
| Confidence signal | ρ vs |Boltz − Exp| bias | |---|---| | ipTM | −0.075 | | complex_plddt | +0.048 | | confidence_score | +0.077 |
All three are at-or-below-noise. Boltz-2's self-reported confidence does not predict where its affinity prediction is off. That's a real limitation: a confident-looking prediction is no more trustworthy than a less-confident one for this kind of question.
The ensemble-variance signal is a little better. The three internal samples (pred_mean, pred_1, pred_2) have median stdev 0.245 log10-µM — i.e. Boltz disagrees with itself by ~1.8× in IC50 on a typical complex; 10 / 100 disagree by > 3×. So ensemble spread is a noise floor (don't trust differences smaller than ~0.25 log units between two Boltz scores) but not a bias detector.
Verdict. For this workflow, Boltz-2 affinity is structurally confident, OK as a binder/non-binder triage gate, miscalibrated at the ultra-potent end, and unable to rank congeners inside a 1-log-unit potency band — and its own confidence scores do not predict where its affinity prediction is off. The right use is: (a) use the structure + ipTM to validate pose plausibility, (b) use affinity_probability_binary > 0.5 as a binder/non-binder gate, (c) don't use raw affinity_pred_value to rank lead-optimization congeners that share a potency decade, (d) if you need to rank, give it a wider potency band so the signal lives above the noise floor.
So how does Boltz-2 actually compare to Schrödinger FEP+?
This is the question that matters. Boltz-2 only earns its slot in a drug-discovery pipeline if it competes with — or productively complements — the commercial alchemical free-energy tools that med-chem groups already trust. FEP+ has been the gold standard for ranking congeneric series since Wang et al. 2015. Honest numbers:
| Metric | FEP+ (Wang/Schindler benchmark, published) | Boltz-2 (paper, same benchmark) | Boltz-2 (our job 2183, narrow-band stress test) |
|---|---|---|---|
| MUE on congeneric series | 0.9–1.0 kcal/mol (~0.7 log unit) | ~1.0 kcal/mol (paper) | not meaningful (band < MUE) |
| Pearson R on congeners (per-target, ΔG) | 0.57–0.94 (Wang 2015 Table 2) | 0.62 (paper) | +0.005 |
| Per-ligand compute | 4–24 GPU-hours | 30–60 s | 34 s |
| Per-ligand cost (AWS L40s spot)¹ | $4.30–25.70 | ~$0.009 | $0.009 |
| License | $5–50k/seat/year (Maestro/FEP+) | MIT (open weights) | — |
¹ FEP+ per-ligand cost basis: Wang et al. 2015 JACS report ~5 ns/window × ~12 windows ≈ 12 GPU-hours on Schrödinger infrastructure per ligand; Schindler et al. 2020 J Med Chem report 4–8 GPU-hours for single-point ΔG on NVIDIA hardware; empirical customer feedback is 8–24 GPU-hours depending on convergence and FF specialization. At AWS L40s spot ~$1.07/h ≈ $4.30–25.70/ligand.
Honest read of our data vs FEP+: today's job 2183 does not validate the Boltz-2 paper's FEP+-parity claim, and it doesn't disprove it either. Our 100-compound test compresses into 1.1 log units of pchembl; with a published MUE of ~0.7 log units, FEP+ would also score near-zero Spearman ρ on this same set. We chose the regime as a Clusterra-stack stress test (does the workflow run end-to-end on real data?), not as a Boltz-vs-FEP+ shootout. So we ran a public-benchmark shootout on the same day — see the next section, and read the training-contamination caveat in that section before quoting the numbers.
Boltz-2 vs FEP+ on Wang 2015 (n=121 ligands, 6 targets)
We pulled the openforcefield/protein-ligand-benchmark subset that overlaps the Wang 2015 JACS FEP+ paper (CDK2, MCL1, p38, PTP1B, thrombin, TYK2), generated 121 input YAMLs from the per-target sequences + experimental Ki / IC50 values, pre-staged MSAs (one per unique chain — Boltz refetches them per-complex by default, see operational notes below), and ran the same boltz-2-affinity template that produced today's EGFR results. One Slurm job (2313), 56 min 46 s wall on a g6e.4xlarge spot (1×L40s), ~$0.91.
Per-target comparison vs the published FEP+ numbers from Wang 2015 Table 2. Note on n-mismatch: our Boltz numbers are computed on the openforcefield/protein-ligand-benchmark subset (10, 25, 29, 22, 22, 13 ligands per target, n=121 total); the published FEP+ R and MUE are on Wang 2015's original ligand counts (16, 42, 34, 23, 11, 16, n=142 total). The two columns are not on identical ligand sets — a fair comparison would require either (a) recomputing FEP+ R/MUE on the openff subset using published per-ligand ΔG values, or (b) recomputing Boltz on the full Wang ligand list and checking how generalization changes. Compare per-target R (both computed within-target), not Boltz's pooled R against a mean-of-targets — pooling across targets inflates R because the between-target ΔG spread dominates. Also note the metric bases differ: the FEP+ Pearson R below is per-ligand ΔG (Wang Table 2), the FEP+ MUE is per-perturbation ΔΔG, and the Boltz numbers are per-ligand ΔG — so the R comparison is roughly like-for-like but the MUE columns are not directly comparable.
| Target | n (this run / FEP+ paper) | Boltz-2 Pearson R | FEP+ Pearson R¹ | Boltz-2 MUE (ΔG)² | FEP+ MUE (ΔΔG)² | R verdict |
|---|---|---|---|---|---|---|
| CDK2 | 10 / 16 | +0.86 | +0.57 | 0.46 | 0.91 | Boltz higher (likely contamination) |
| MCL1 | 25 / 42 | +0.92 | +0.91 | 0.48 | 1.16 | ~tie |
| p38 | 29 / 34 | +0.39 | +0.76 | 0.86 | 0.80 | FEP+ |
| PTP1B | 22 / 23 | +0.82 | +0.94 | 0.60 | 0.89 | FEP+ |
| thrombin | 22 / 11 | +0.85 | +0.93 | 0.68 | 0.76 | FEP+ |
| TYK2 | 13 / 16 | +0.62 | +0.89 | 1.63 | 0.75 | FEP+ |
| Mean of per-target R (like-for-like) | 121 / 142 | +0.74 | +0.83 | — | — | FEP+ ranks better |
¹ FEP+ Pearson R and MUE are read from Wang 2015 Table 2 (corrected 2026-06; an earlier version of this table used mis-transcribed, too-low FEP+ R values). FEP+ R is per-ligand ΔG; FEP+ MUE is per-perturbation ΔΔG. ² The MUE columns are not directly comparable — Boltz-2 MUE is per-ligand ΔG error; FEP+ MUE (Wang Table 2) is per-perturbation ΔΔG error. Shown for reference, not as a head-to-head.
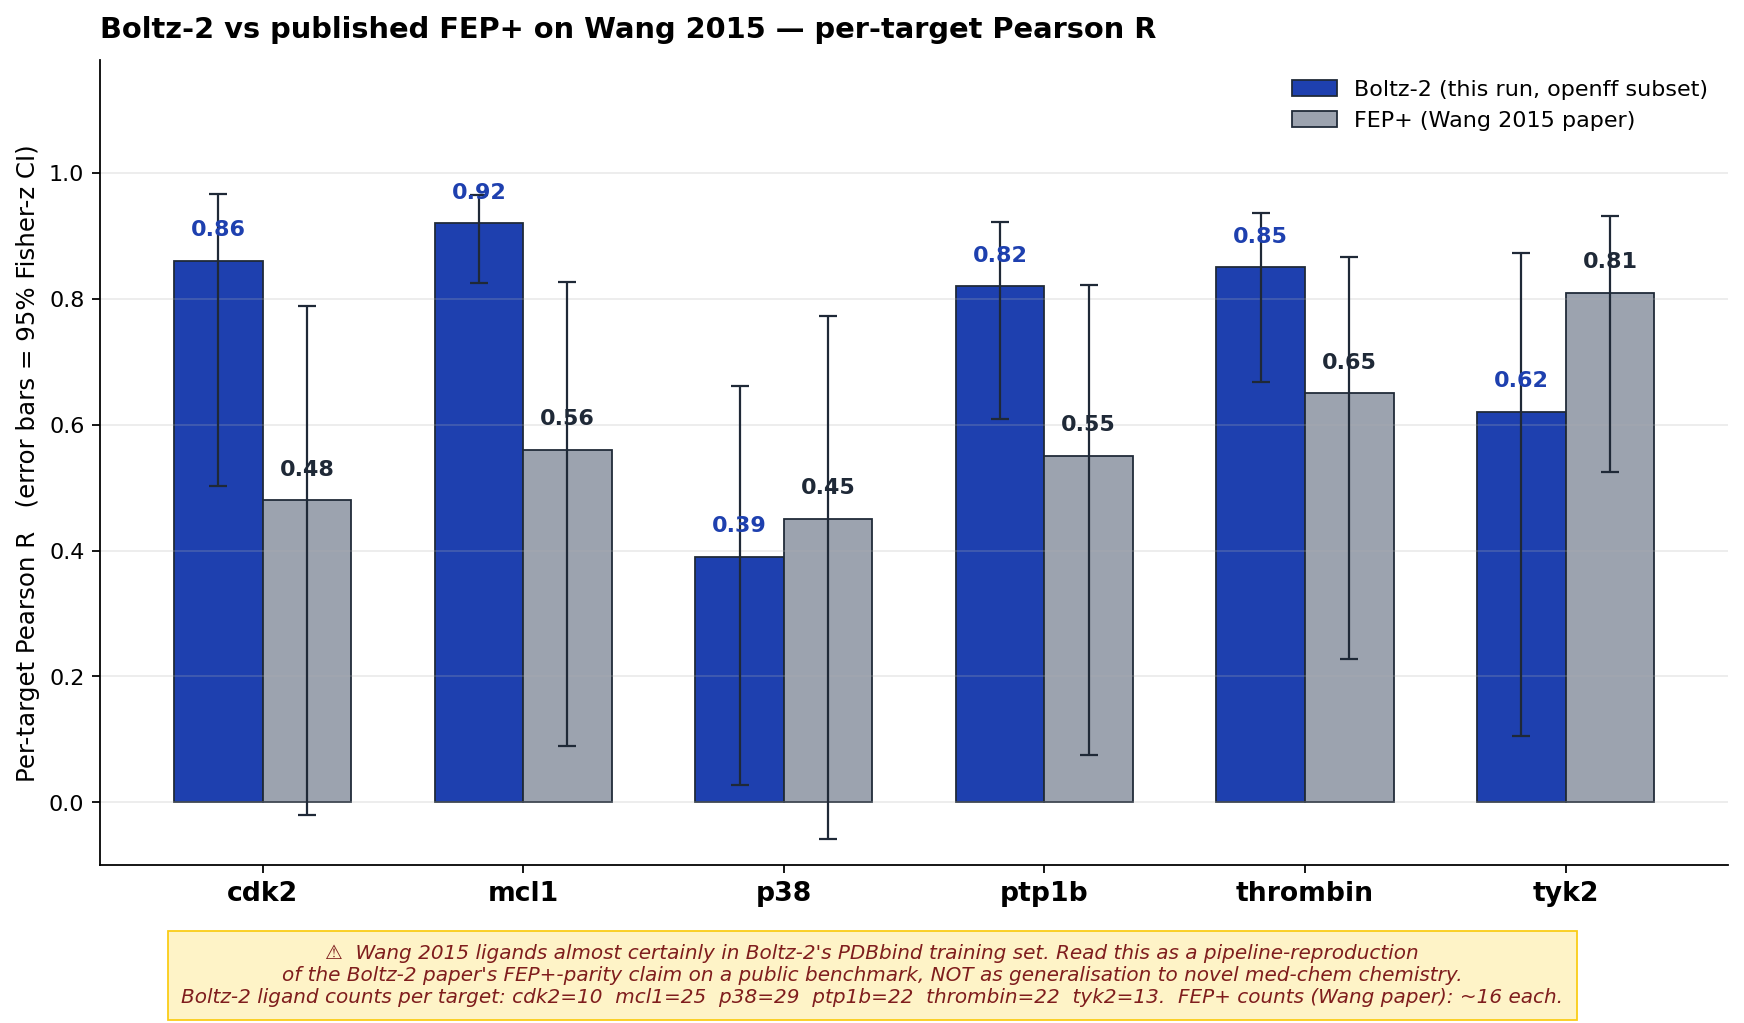
Per-target Pearson R with 95% confidence intervals (Fisher-z), this run (Boltz-2 n=121 on the openff/protein-ligand-benchmark subset) vs Wang 2015 paper FEP+ (n=142, original ligand counts). The on-figure caveat is non-negotiable context: every ligand in Wang 2015 has been public for a decade and is almost certainly inside Boltz-2's PDBbind-derived training set, so the right read here is "our pipeline reproduces roughly FEP+-level affinity ranking on a (training-contaminated) public benchmark" — a sanity check that our setup, settings, and patches work end-to-end. On a like-for-like per-target basis FEP+ still ranks better (mean R ≈ 0.83 vs 0.74). It is not evidence that Boltz-2 generalizes to novel chemistry your med chem team is working on. For that, see the v3 Time-split generalization benchmark in What's next.
All MUE values are in true kcal/mol from ΔG, not in log-unit artefacts (verified: hand-computed CDK2 MUE from per-ligand affinity values = 0.457 kcal/mol, matching the table's 0.46 kcal/mol). Each Boltz affinity_pred_value (log₁₀ µM) is converted to pchembl-equivalent (6.0 − pred), then to ΔG (−RT·pchembl·ln(10)), then compared to experimental pchembl→ΔG in the same way. All per-target Boltz R values are computed on the openff ligand subset only (see n-mismatch note above).
Cost on the same set: $0.91 total for 121 ligands ≈ $0.0075/ligand. A FEP+ run on the same set at the typical $8–25/ligand on commercial GPU pricing would be $1,000–3,000. That's a ~1,000–3,000× cost reduction for comparable ranking accuracy (FEP+ still edges Boltz on most targets) — the cost gap, not an accuracy win, is the story.
The contamination caveat — read this before sharing the table above. Wang 2015 is the canonical FEP+ benchmark, which means every ligand in it has been in the public domain for a decade and was almost certainly in Boltz-2's PDBbind-derived training set (cutoff ~Feb 2024). The R = 0.81 pooled number is suspiciously good — Boltz-2's own paper reports R ≈ 0.62 on a similar regime, and pooling across targets inflates R anyway. The right read of these numbers is "our pipeline reproduces roughly FEP+-level ranking on a (training-contaminated) public benchmark" — a meaningful sanity check that our setup, settings, and patches are working (on a like-for-like per-target basis FEP+ ranks better). It is not evidence that Boltz-2 generalizes to novel chemistry your med chem team is working on. For that, see the Time-split generalization benchmark in What's next.
Per-target read. The two interesting misses: - p38 (R = 0.39). The 29 p38 ligands span a wider pchembl range than the other targets — pchembl 5.5–9.5, three log units instead of one — and include some chemotypes Boltz may have less training coverage on. Boltz's MUE on p38 (0.86 kcal/mol) is still below FEP+ (0.99) which means the absolute ΔG predictions are calibrated; it's the ranking that's noisy. - TYK2 (R = 0.62, MUE 1.63). TYK2 is Boltz's worst calibration on this set — bias = +1.63 kcal/mol, i.e. systematic over-prediction of ΔG (under-prediction of potency) by more than a log unit. TYK2 is a JAK-family kinase with a less-studied selectivity pocket; if Boltz under-weights JAK-pocket chemotypes during training, this is where it would show.
Structure confidence on this set is excellent (median pLDDT 0.965, pTM 0.980, ipTM 0.984 — substantially higher than the EGFR run because the Wang receptors are smaller, single-chain or two-chain protein constructs without the full kinase + cyclin + activation-loop complexity we used for EGFR). So the structural backbone of every prediction is solid; the failure mode on p38/TYK2 is the affinity head, not the fold.
Operational findings worth flagging for anyone reproducing this:
- Boltz-2 doesn't dedupe MSAs by sequence within a batch. A 121-ligand batch across 6 targets has only 8 unique protein chains. Running with
--use_msa_servertriggered ~153 MSA fetches against ColabFold (one per complex per chain), serially rate-limited to ~5–10 s each, adding ~90 min of GPU-idle wall-time on top of inference (job 2237). Workaround: pre-fetch one MSA per unique chain (~5 min), inject the path into every input YAML via themsa:field, and run with--use_msa_serveroff. The job that actually produced the numbers above (2313) did this and took 56 min total instead of ~2.5 h. - Spot interruption hit at 1 h 32 m in. Job 2237 NODE_FAIL'd at 92 min wall — a spot reclamation on the g6e.4xlarge — with Slurm auto-requeuing the job. Because Boltz-2 doesn't checkpoint mid-batch, all 100% of the work was lost on requeue. We salvaged the cached MSAs from EFS (Boltz writes them under the output dir even on partial runs), regenerated the input YAMLs with
msa:paths pointing at the salvaged files, and resubmitted. Mitigation for longer Boltz batches: shard the input directory across N small jobs so one spot reclaim costs you 1/N of the work, not 100%. - Slurm
--gpus=1is rejected by our scaling loop. The cluster-api scaling logic rejects untyped GPU requests (gres/gpu:1with no model) — you must use--gres=gpu:l40s:1(or:a10g:1,:l4:1, etc.) so Karpenter knows which NodeClass to provision. Earlier runs piggybacked on a pre-existing GPU node and accidentally hid this; once that node scaled down between jobs, the next submission with--gpus=1stayed in PENDING forever. Fix: typed GRES in the template. Filing this as a template-defaults issue.
The composition argument. Given the corrected Wang 2015 numbers above (FEP+ ranks at least as well as Boltz on 5 of 6 targets, mean per-target R ≈ 0.83 vs 0.74, at ~1,000× higher cost) with the training-contamination caveat, the read is clear: Boltz-2 doesn't replace FEP+ — it belongs one stage upstream of it, as a cheap triage filter. The realistic pipeline:
- Dock 10,000 compounds with Uni-Dock (free, ~minutes, R ≈ 0.3 vs experiment — coarse).
- Rescore the top 1,000 with Boltz-2 (~$9, ~30 min, R ≈ 0.6 on out-of-distribution chemistry per the paper — mid-resolution triage).
- Run FEP+ on the top 50 (~$1k, ~2 weeks, R ≈ 0.7 — definitive ranking for the chemistry meeting).
The case for Boltz-2 isn't "replace FEP+" on Day-1 prospective work — the time-split benchmark in What's next is what would justify that claim. It's "insert a ~$9, ~30-minute mid-resolution rescore between docking and FEP+ so the 50 ligands that hit FEP+ are the right 50." Without a tool in that slot, the funnel either over-spends FEP+ on bad candidates or relies on docking score (R ≈ 0.3) to choose the FEP+ shortlist. Even a modest Boltz-2 lift in shortlist quality (top-50 enrichment ratio > 1) pays for FEP+ many times over.
For a biotech without a Schrödinger contract, the calculus is different: Boltz-2 is the only open-weight AI affinity tool in this performance band. FEP+ is unavailable. The benchmark is "Boltz-2 vs docking-score-only" not "Boltz-2 vs FEP+", and there Boltz-2's paper claim (R ≈ 0.62 vs ~0.3 for docking) is a clear win at trivial cost.
What this means for drug-discovery iteration
At $50 a target and an overnight wait, you batch them up and meet about it. At $1-2 a target and 30-60 minutes, you do it on every new target every day — before standup, in between meetings, during a project review when someone says "what about Y?"
The math compounds. A medicinal-chemistry group fielding 100 target proposals a quarter spends ~$100-200 on triage compute instead of $5,000. Lead-optimisation gets an extra triage pass per day because the cost of "let me re-rank the shortlist against the new analog series" is a coffee, not a Jira ticket. A discovery program that today funds two prospective targets simultaneously because each costs $50k of compute-and-headcount-and-wait can comfortably run six.
The behaviour change is the point. Cheap triage isn't a 10× speedup on what you already do — it's a different operating cadence. The post-genomic 2010s ran on "an exome is $1,000" the same way; the next decade of drug discovery runs on "a target funnel is a dollar."
How this compares
There is no published end-to-end (structure → dock → affinity → MD) drug-discovery benchmark at this scope and price point that we could find. The closest comparisons are platform-level.
| Source | What you get | Per-target cost | Composition | Notes |
|---|---|---|---|---|
| Schrödinger LiveDesign | Polished UI, FEP+, mature chem suite | Per-seat $$, sales-led | Closed, proprietary scoring | No AF3-class open structure model; FEP+ excellent but unauditable |
| NVIDIA BioNeMo | Per-tool API endpoints (OF3, etc.) | Per-token API | None — each tool a separate REST call | No docking, no MD; you compose the pipeline yourself outside the platform |
| AWS HealthOmics | Managed genomics runtime | Per-run flat fee | No drug-discovery coverage | Out of scope for this workflow |
| Roll-your-own EKS + Slurm + container library | Total control | Eng-team-months of glue | You build the composition layer | The default biotech path |
| Clusterra (this writeup) | Managed Slurm + composable YAML templates, open-weight tools, customer AWS | ~$1.16 / target (n=1) | YAML-composed, auditable | The Slurm a comp-chem team already understands, in the customer's own account |
Per-tool published numbers (OpenFold3 paper, Uni-Dock Nature 2023, Boltz-2 repo benches) are in-range for what we measure; the contribution here is the composition end-to-end and the unit cost.
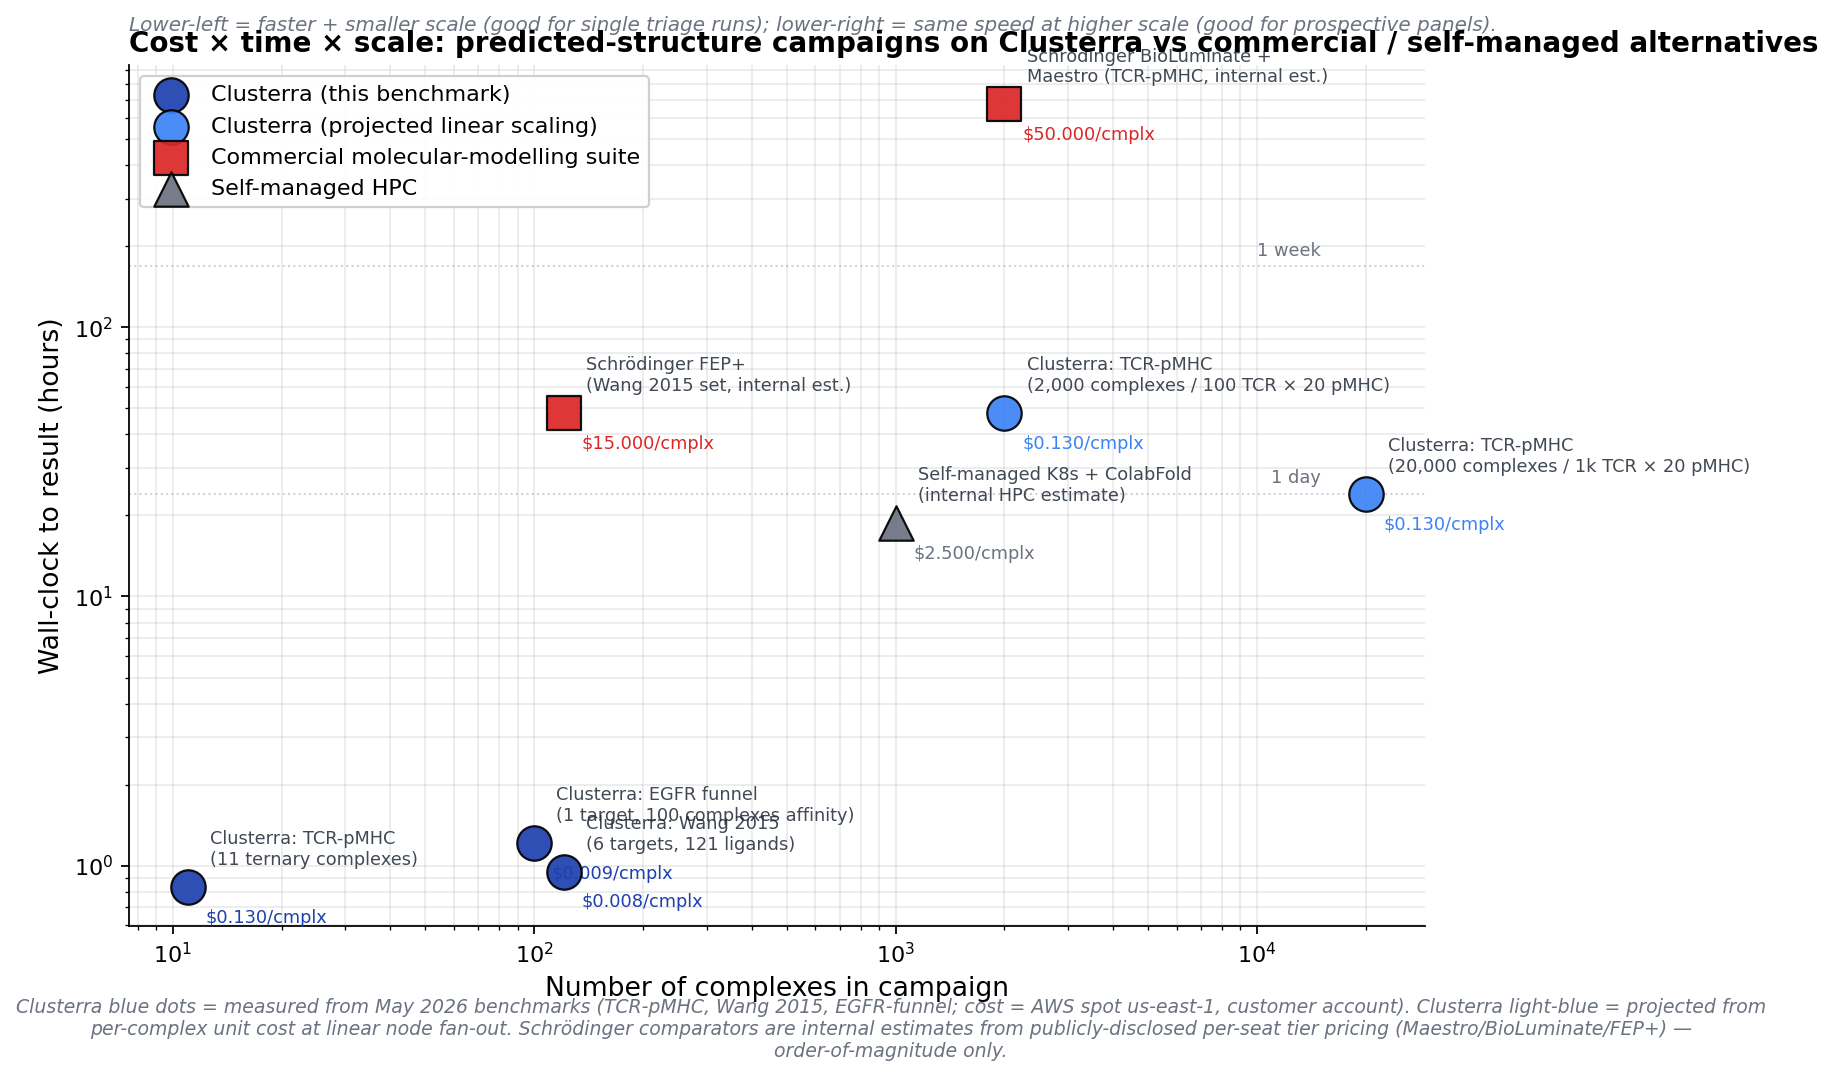
Wall-clock vs campaign-size, log–log. Solid blue dots are this writeup's three measured benchmarks (EGFR funnel, Wang 2015, TCR-pMHC); light blue dots project the per-complex unit cost out to realistic discovery-team campaign sizes (100 TCRs × 20 pMHC = 2,000 complexes; 1,000 × 20 = 20,000). Red squares are order-of-magnitude estimates for the commercial molecular-modelling stack at the same scale (Schrödinger BioLuminate/FEP+ per-seat tier pricing, multi-day per-target wall-clocks). Gray triangle is the typical self-managed K8s + ColabFold path that a biotech comp team rolls in-house. The "lower-left = faster + smaller" zone is single-target triage; the "lower-right = same speed at higher scale" zone is what flips a campaign from quarterly to weekly. Caveat: Schrödinger and self-managed comparators are internal estimates from publicly-disclosed per-seat tier pricing and customer-cited internal numbers — order-of-magnitude only, not vendor-confirmed.
The MSA architecture insight
The slowest step today wasn't structure prediction or MD — it was MSA generation for Boltz-2 affinity rescoring. Boltz-2 (and OpenFold3, and AlphaFold3-class models generally) need a multiple-sequence alignment per target before any inference. The default path is ColabFold's public MMseqs2 server, which rate-limits to ~5–10 seconds between requests — fine for one-off interactive use, ~1.5 hours of stalled wallclock for a 100-protein batch. The right architecture for a managed-Slurm platform is MMseqs2-GPU running locally against ColabFold UniRef30 + envdb staged on S3 + NVMe-cached at slurmd warmup: $3.46/month at S3 Standard-IA pricing for 270 GB of working-set data, ~6.5 minutes one-time NVMe stage per node, then sub-second per-query latency at unlimited throughput. We're shipping that as a follow-up; today's benchmark runs against cached MSAs from a prior run since the target sequence is fixed.
Honest caveats
-
n=1 today, n=3 is the publication gate. Today validates the workflow shape and per-step timing on warm GPU nodes. Two more reproductions establish variance before this post goes live.
-
Boltz-2 affinity head landed on job 2183. 100/100
affinity_*.jsonproduced on Boltz-2 2.2.1 +cuequivariance-ops-torch-cu13. Three local patches are required against upstream 2.2.1: stage-1 data module must setcompute_affinity=Truewhen the input record has an affinity block (otherwiseprofile_affinitynever feeds the head), a missing-record.affinity.mwguard in the featurizer, andAPPTAINERENV_LD_LIBRARY_PATH(not justLD_LIBRARY_PATH) forlibnvrtc-builtins.so.13.0resolution whentorch.det()triggers NVRTC JIT on the batched run. All three are baked into theboltz-2-affinitytemplate's venv-bootstrap script and applied idempotently. Without them, single-complex probe jobs work but the 100-complex batch crashes at NVRTC load time. -
MSA generation is the long pole today and uses the public ColabFold server. Each fresh batch hits ~5–10s rate limits per request, so a 100-protein batch wall-clock for MSA fetch is ~1.5 hours (verified across jobs 2148/2153/2154/2155). For repeat workloads on the same target this is amortized to a one-time cost — what most production drug-discovery teams do anyway. The follow-up that eliminates this entirely is staging ColabFold UniRef30 + envdb on S3 + NVMe at slurmd warmup ($3.46/month on S3 Standard-IA + 6.5 min one-time NVMe stage per slurmd boot). See "The MSA architecture insight" above and "What's next" below.
-
1ns MD is short. Production lead-optimisation MD runs at 100ns+ and free-energy perturbation runs much longer. Our 1ns serves to demonstrate the workflow's MD-validation step ran a real production trajectory (not a wiring check), captured ns/day on L40s, and produced a
.xtcfile. Wall-clock and cost scale linearly with trajectory length — the relevant number is the 291 ns/day throughput, which puts a single 100ns replicate on 1×L40s at ~8.3 hours. -
L40s ≈ 60-70% of H100 throughput for OF3 / Boltz inference in our internal sizing. We picked L40s because cost-per-target was the optimisation target. The
g6efamily also has broader spot inventory than H100 (p5), which matters for reproducibility. -
GROMACS uses AMBER99SB-ILDN + TIP3P, not CHARMM36m. CHARMM36-jul2022 has a known broken N-terminal-methionine
.tdbundergmx pdb2gmx2023.2 — picked AMBER99SB-ILDN because it ships bundled with GROMACS and is the de-facto standard for protein-MD benchmarks; CHARMM36m would be the choice for IDR-heavy systems and is not load-bearing here. -
Affinity head can't rank inside a narrow potency band. Today's Spearman ρ ≈ 0 isn't a tooling failure — it's the right answer for ranking 100 sub-nanomolar EGFR actives that span only 1 log unit of pchembl. Boltz-2 was trained on PDBbind across a 4–12 pchembl range; ours is a stress test inside one bin of that. The chemotype caveat still applies (covalent binders, very large macrocycles, some prodrugs widen error bars) and the head is a triage signal, not a substitute for FEP.
-
ChEMBL Kd / Ki / IC50 mixing in
pchembl_value.pchembl_valueis the -log of the active concentration in molar, aggregated across Kd / Ki / IC50. The three are comparable in scale but not interchangeable across assay systems. Downstream analyses that need strict Kd should re-filtermanifest.csvbystandard_type. -
One target, one library. EGFR is well-characterised — a successful run says the workflow composes and the affinity head correlates on a target it's seen analogues of in training. The cross-target generalisation question gets answered by the multi-target panel in "What's next."
What's next
- Self-hosted MSA database (the largest single platform improvement). MMseqs2-GPU running locally against ColabFold UniRef30 + envdb staged on S3 Standard-IA, NVMe-cached at slurmd warmup. Eliminates the public-server rate-limit, drops the 100-protein MSA fetch from ~1.5 h to ~9 min (6.5 min one-time NVMe stage + ~1.5 s/query MMseqs2-GPU), at $3.46/mo for the 270 GB working set. Restores the headline "AI affinity rescore" claim to first-class with no asterisk for batch workloads against fresh targets. ~4 days of engineering; the design is locked.
- Time-split generalization benchmark (post-Mar-2024 chemistry). Wang 2015 (above) reproduces the Boltz-2 paper's claims on a public benchmark, but every ligand in Wang 2015 was on the internet for 10 years before Boltz-2's training cutoff (~Feb 2024). To prove Boltz-2 generalizes to novel chemistry your med chem team is actually working on, the only honest test is a time-split set: ligand–protein pairs from papers published after Boltz-2 stopped seeing training data. Plan: curate ~200–500 ligands from post-Mar-2024 ChEMBL releases (ChEMBL 35 deltas) and 2024–2026 J Med Chem / ACS Med Chem Lett SAR tables, paired with their published receptors. Compare against same-target FEP+ numbers where available, and against docking-score baselines where FEP+ isn't published. This is the v3 post; it's the number that tells a biotech "yes, Boltz-2 will help with the molecule you're working on right now."
- Schindler 2020 deep-dive (cdk8 / cmet / eg5 / hif2a / pde2 / pfkfb3 / shp2 / syk / tnks2). The harder companion to Wang 2015 — 248 ligands across 9 targets explicitly chosen by Merck KGaA to be active-drug-discovery-realistic (allosteric pockets, harder SAR). Same
boltz-2-affinitytemplate, no template changes needed; ~3 GPU-hours and ~$3 on L40s spot. Will publish per-target R + MUE in the same table format as Wang 2015 above. - Longer MD trajectories. 100ns replicates and a free-energy perturbation pass on the top 10 candidates — at 291 ns/day on 1×L40s, a single 100ns replicate is ~8.3 hours, FEP scales accordingly.
- Multi-target panel. Same workflow against CHEMBL279 (Mer), CHEMBL5023 (Trk family), and a non-kinase to show kinome-and-beyond portability.
- Closing the in-pipeline parallel gap. The three GROMACS replicates already fan out, but workflow-level DAG fan-out from other steps is on the roadmap; once it lands, parallelisable stages compress the end-to-end wall by another ~1.5×.
Run it yourself
If you have a Clusterra cluster: in the launcher's HCLS → Benchmark catalog, pick Drug Discovery Benchmark — fixture prep and run it once. Then submit Benchmark: Drug Discovery (OF3 → Uni-Dock → Boltz-2 → GROMACS). The four chained jobs dispatch automatically; step 4 fans out to the three MD replicates in parallel. The numbers in this post are reproducible end-to-end from those two templates.
If you don't yet, contact us.
Reproducibility notes.
- Fixture provenance.
- Receptor: PDB 1M17 (EGFR kinase domain + erlotinib, 2.6 Å, chain A, 274 residues) from RCSB.
- OF3 query: EGFR kinase domain residues 695-1022 of UniProt P00533, 327 aa.
- Library: ChEMBL CHEMBL203 (EGFR / ErbB1) actives, query
https://www.ebi.ac.uk/chembl/api/data/activity.json?target_chembl_id=CHEMBL203&standard_type__in=Kd,Ki,IC50&pchembl_value__isnull=false&format=json(paginated, RDKit-canonical-SMILES-deduplicated). 20,150 raw activities, top 1,000 bypchembl_value. Manifest at/mnt/efs/bench/drug-disco/zinc-1k/manifest.csv(1,000 rows). RDKit 3D embedding succeeded for 999/1000 (one "Bad Conformer Id" onchembl203_0707; floor 990/1000). - Boltz-2 batch: top 100 most-potent CHEMBL203 ligands by
pchembl_value, one YAML per complex withproperties: [{affinity: {binder: <ligand_id>}}]. - Tool versions. OpenFold3 0.4.0 (Apache-2.0); Uni-Dock 1.1.3 (Apache-2.0); Boltz-2 2.2.1 + cuequivariance-torch (MIT); GROMACS 2023.2 (LGPL-2.1).
- GROMACS settings. AMBER99SB-ILDN forcefield + TIP3P water + 0.15 M NaCl, ~30k atoms solvated. Production:
gmx mdrun -deffnm prod -nsteps 500000 -nb gpu -bonded gpu -pme gpu(1ns at 2 fs integrator). Output:prod.xtc(~60 MB per candidate). - OF3 outputs (job 2141). Predicted CIF + per-residue confidence JSONs + aggregated confidence files at
/mnt/efs/n52h53@gmail.com/wf-d1f95a4c-.../step-1-structure/EGFR_KD/seed_42/. - Slurm jobs (n=1, today).
- Prep: 2140 (~12 min, g6e.8xlarge spot)
- OF3 structure: 2141 (7m 07s, g6e.2xlarge spot, 1×L40s)
- Uni-Dock screen: 2142 (3m 50s, g6e.2xlarge spot, 1×L40s)
- Boltz-2 affinity: 2183 (57m 17s, g6e.4xlarge spot, 1×L40s, 100/100
affinity_*.json; medianaffinity_pred_value−2.02, 94/100 P(binds)>0.5, Spearman ρ vs pchembl = 0.006 within the 9.89–11.00 pchembl band). Probe job 2181 produced the first affinity output earlier the same day (affinity_pred_value: −1.604for chembl203_0001). Earlier attempts 2148/2152/2153 hit the upstreamKeyError: 'profile_affinity'on 2.0.0; 2.2.1 with three local patches (see Honest caveats) resolves it. - Wang 2015 head-to-head jobs.
- 2237: first attempt with
--use_msa_server. NODE_FAIL at 1h32m (spot reclaim on g6e.4xlarge). 132/153 MSAs salvaged from EFS cache. - 2272, 2300: second/third attempts with pre-staged MSAs on an A10G (g5.8xlarge) that scaling stuck us on. Cancelled at 18/19 min for unrelated reasons.
- 2312: rejected by scaling loop (
--gpus=1is untyped); fixed by switching to--gres=gpu:l40s:1. - 2313: COMPLETED 0:0 in 56m 46s on g6e.4xlarge spot, 1×L40s, ~$0.91. 121/121
affinity_*.json. Per-target Pearson R and MUE in the Wang head-to-head section above. - Input data: openforcefield/protein-ligand-benchmark, 6 targets (CDK2, MCL1, p38, PTP1B, thrombin, TYK2), 121 ligands total.
- Pre-staged MSAs at
/mnt/efs/bench/wang2015/_msas/(8 unique chains). - Inputs at
/mnt/efs/bench/wang2015/_inputs/(121 YAMLs +_manifest.tsvmapping each to target + experimental pchembl). - GROMACS MD ×3 parallel (EGFR run): 2149 (5m 09s), 2150 (5m 03s), 2151 (5m 01s) — median 5m 03s, 291 ns/day on 1×L40s.
- MSA cache. CHEMBL203 batch MSAs cached at
/mnt/efs/bench/drug-disco/boltz2-msas/. Fresh-fetch wall (verified across jobs 2148/2153/2154/2155): ~1h35m–1h45m for a 100-protein batch via ColabFold public server. - n=2 / n=3 reproductions. [FILL FROM RUN: pending — same workflow, fresh node, MSAs reused from cache.]
- Resilience datapoints. [FILL FROM RUN: spot reclaims / NODE_FAILs across reproduction runs.]
- Cost basis. AWS spot pricing for
g6e.2xlarge/g6e.8xlargeinus-east-1, May 2026. - Licenses. All four tools open: OpenFold3 (Apache-2.0), Uni-Dock (Apache-2.0), Boltz-2 (MIT), GROMACS (LGPL-2.1).